Behavioral Analytics
Play style tendencies, coaching philosophy analysis, and archetype correlations
League-Wide Tendency Correlations
Driving Frequency
r = -0.145
vs impact
p < 0.01 **
n = 345
Roll % (vs Pop)
r = -0.181
vs impact
p < 0.001 ***
n = 345
Catch & Shoot % (vs Pull-Up)
r = 0.156
vs WS/48
p < 0.01 **
n = 345
Corner 3 % (vs ATB)
r = 0.135
vs WS/48
p < 0.05 *
n = 345
Position-Stratified Correlations (vs BPM)
| Tendency | PG r (n) | SG r (n) | SF r (n) | PF r (n) | C r (n) |
|---|---|---|---|---|---|
| Driving Frequency | +0.070 (84) | -0.164 (19) | -0.156 (39) | +0.175 (92) | -0.294 (111) |
| Roll % (vs Pop) | -0.034 (84) | -0.227 (19) | +0.188 (39) | -0.188 (92) | -0.208 (111) |
| Catch & Shoot % (vs Pull-Up) | +0.262 (84) | +0.563 (19) | +0.162 (39) | -0.022 (92) | +0.039 (111) |
| Corner 3 % (vs ATB) | +0.067 (84) | +0.348 (19) | +0.273 (39) | +0.220 (92) | -0.188 (111) |
Bold = |r| > 0.15 and p < 0.05 (actionable correlation)
Denver Tendency Gaps vs League Average
| Position | Tendency | League Mean | Denver Mean | Gap (Δ) | Verdict |
|---|---|---|---|---|---|
| PG | Driving Frequency | 55.1 | 50.0 | -5.1 | Close |
| PG | Roll % (vs Pop) | 24.1 | 15.5 | -8.6 | Notable |
| PG | Catch & Shoot % (vs Pull-Up) | 51.0 | 60.0 | +9.0 | Notable |
| PG | Corner 3 % (vs ATB) | 59.9 | 65.5 | +5.6 | Close |
| SF | Driving Frequency | 57.0 | 48.0 | -9.0 | Notable |
| SF | Roll % (vs Pop) | 22.2 | 29.5 | +7.3 | Close |
| SF | Catch & Shoot % (vs Pull-Up) | 54.4 | 75.0 | +20.6 | Notable |
| SF | Corner 3 % (vs ATB) | 59.2 | 64.5 | +5.3 | Close |
| PF | Driving Frequency | 58.8 | 46.5 | -12.2 | Notable |
| PF | Roll % (vs Pop) | 32.4 | 30.0 | -2.4 | Close |
| PF | Catch & Shoot % (vs Pull-Up) | 65.0 | 49.0 | -16.0 | Notable |
| PF | Corner 3 % (vs ATB) | 56.3 | 44.0 | -12.3 | Notable |
| C | Driving Frequency | 49.5 | 52.0 | +2.5 | Close |
| C | Roll % (vs Pop) | 70.8 | 60.0 | -10.8 | Notable |
| C | Catch & Shoot % (vs Pull-Up) | 83.2 | 96.0 | +12.8 | Notable |
| C | Corner 3 % (vs ATB) | 56.3 | 56.5 | +0.2 | Close |
Actionable insight: No tendency insights available yet.
Tendency × Performance Correlations
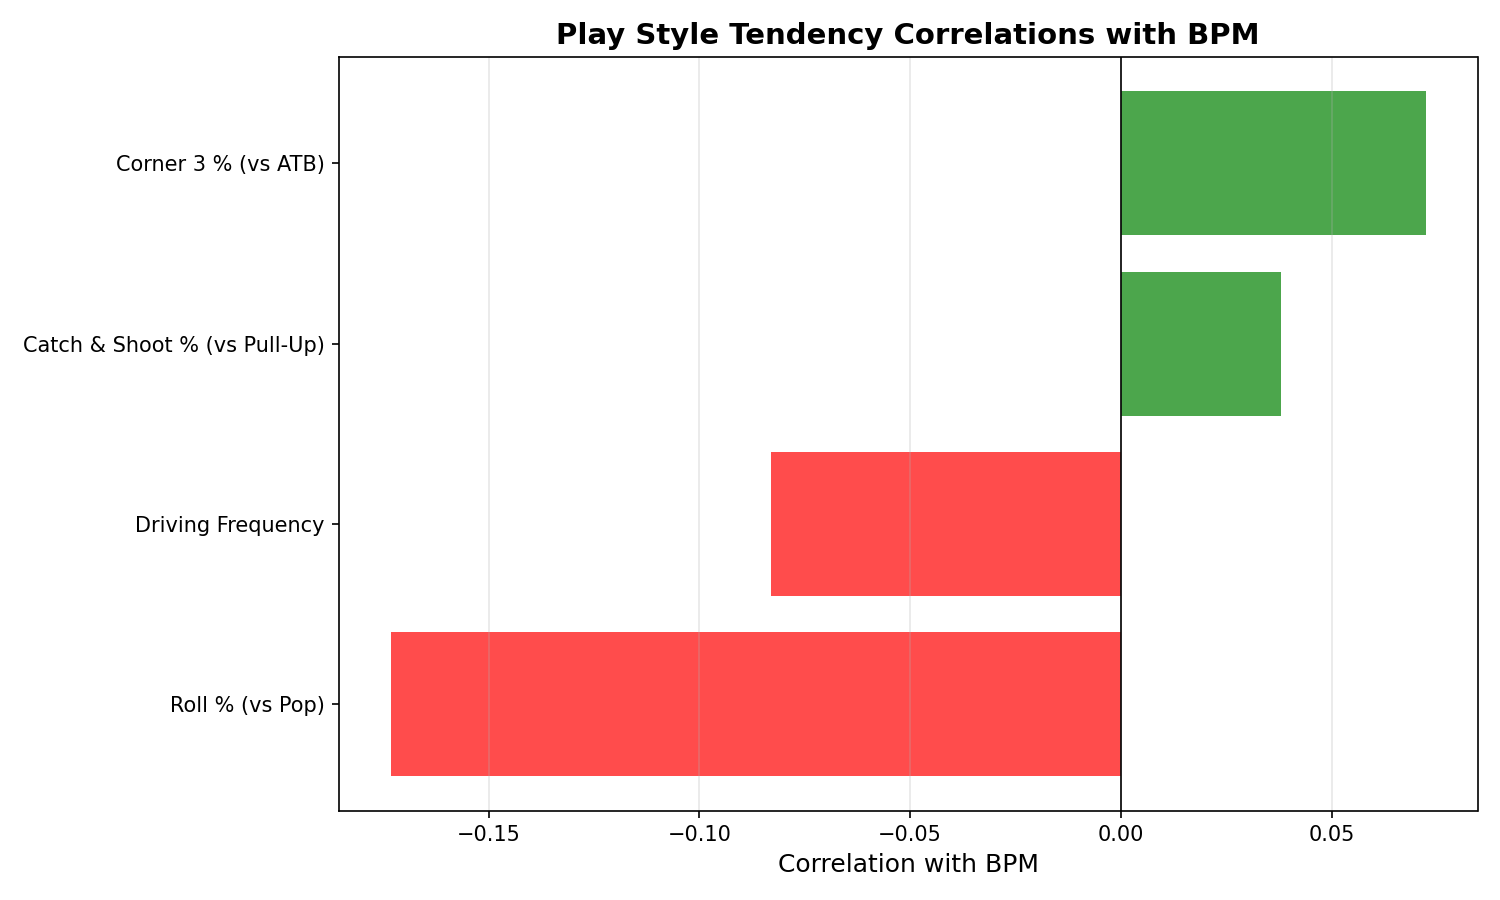
All correlations with n ≥ 10. Bars show Pearson/Spearman r values across three outcomes (Box Score Impact, Win Shares per 48 Min, Impact).
Archetype Performance Profiles
driver
Drive-First
Impact 48.9
n = | Box Score Impact +0.1
Top players:
- Devonte Bell (Chicago Jailbirds, Impact 83)
- Derrick Lynch (Seattle Thunder, Impact 79)
- Russell Boozer (Cincinnati Kings, Impact 75)
Balanced Driver
Impact 52.7
n = | Box Score Impact +0.8
Top players:
- Stanley Amakor (Chicago Jailbirds, Impact 90)
- Cedric Rodgers (Los Angeles Fireballs, Impact 78)
- Austin Ross (Baltimore Bullets, Impact 76)
Non-Driver
Impact 52.0
n = | Box Score Impact +0.4
Top players:
- Veljko Pavlovic (Oklahoma City Barons, Impact 87)
- Cole Kopelani (Mexico City Jaguars, Impact 86)
- Kavian Hawes (Kansas City Knights, Impact 85)
shooter
C&S Specialist
Impact 52.2
n = | Box Score Impact +0.3
Top players:
- Stanley Amakor (Chicago Jailbirds, Impact 90)
- Veljko Pavlovic (Oklahoma City Barons, Impact 87)
- Cole Kopelani (Mexico City Jaguars, Impact 86)
Balanced Shooter
Impact 52.6
n = | Box Score Impact +0.7
Top players:
- Devonte Bell (Chicago Jailbirds, Impact 83)
- Alzee Sessoms (Cleveland Giants, Impact 77)
- Austin Ross (Baltimore Bullets, Impact 76)
Pull-Up Heavy
Impact 48.6
n = | Box Score Impact +0.2
Top players:
- Kavian Hawes (Kansas City Knights, Impact 85)
- Derrick Lynch (Seattle Thunder, Impact 79)
- Cedric Rodgers (Los Angeles Fireballs, Impact 78)
roller
Roll Man
Impact 48.0
n = | Box Score Impact -0.2
Top players:
- Veljko Pavlovic (Oklahoma City Barons, Impact 87)
- Demitrius Burns (Portland Lumberjacks, Impact 78)
- Marco De Luca (Oklahoma City Barons, Impact 76)
Balanced Roller
Impact 51.7
n = | Box Score Impact +0.6
Top players:
- Cole Kopelani (Mexico City Jaguars, Impact 86)
- Devonte Bell (Chicago Jailbirds, Impact 83)
- Derrick Lynch (Seattle Thunder, Impact 79)
Pop Specialist
Impact 53.5
n = | Box Score Impact +0.8
Top players:
- Stanley Amakor (Chicago Jailbirds, Impact 90)
- Kavian Hawes (Kansas City Knights, Impact 85)
- Cedric Rodgers (Los Angeles Fireballs, Impact 78)
Archetype Performance Comparison
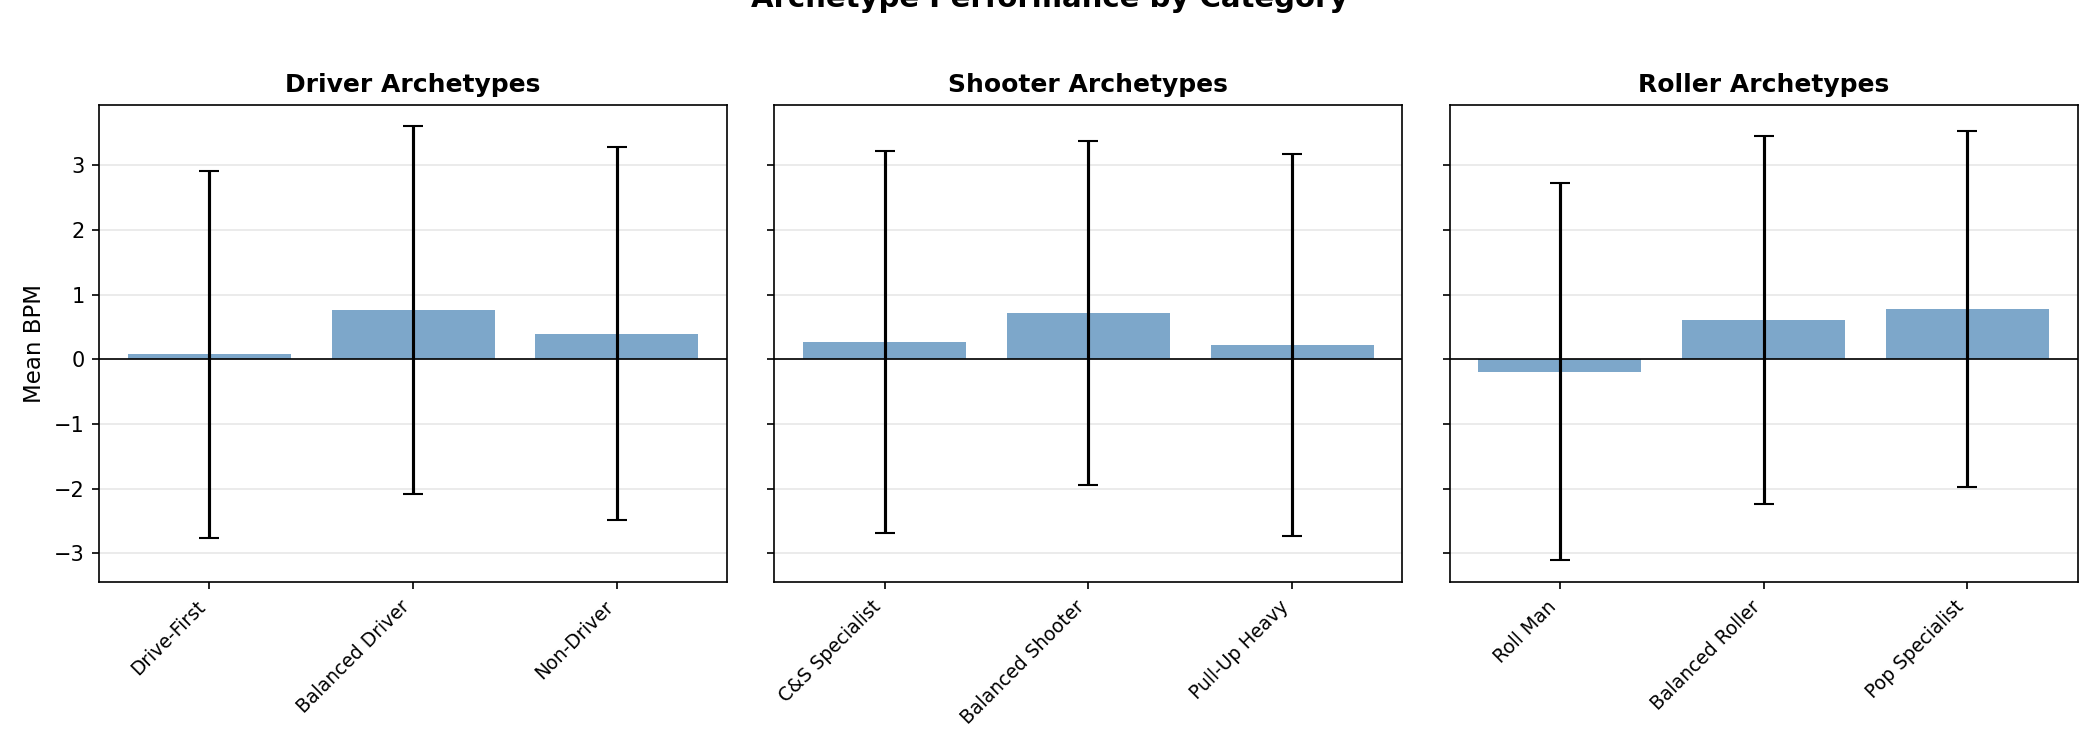
Mean Box Score Impact and Impact by archetype. Error bars show 95% confidence intervals.
Denver Dragons Coaching Evaluation
Current State
HC Philosophy:
Balanced
Roster-Inferred:
Balanced
Alignment:
Aligned
Ideal Coaching Profile
Primary System:
Balanced
Alternative:
N/A
Reasoning
Roster strongest in Balanced (score 20.0)
Coaching Philosophy Correlations with Win%
| Philosophy | r with Win% | p-value | n |
|---|---|---|---|
| Triangle 🏆 | +0.218 | 0.202 | 36 |
| Seven Seconds 🏆 | +0.167 | 0.331 | 36 |
| Post Centric 🏆 | +0.163 | 0.341 | 36 |
| Pace And Space | +0.131 | 0.447 | 36 |
| Perimeter Centric | +0.060 | 0.729 | 36 |
| Balanced | -0.079 | 0.645 | 36 |
| Morey Ball | -0.209 | 0.220 | 36 |
| Grit And Grind | -0.490 | < 0.01 ** | 36 |
Coach-Roster Philosophy Alignment
HC declared philosophy vs roster-inferred philosophy. Mismatches flagged.
| Team | HC Philosophy | Roster-Inferred | Win% | Aligned |
|---|---|---|---|---|
| Austin Rockets | Triangle | Balanced | 68.9% | Mismatch |
| Las Vegas Scorpions | Balanced | Balanced | 67.7% | Yes |
| St Louis Skyhawks | Balanced | Balanced | 67.5% | Yes |
| Cleveland Giants | Balanced | Balanced | 67.0% | Yes |
| Atlanta Devils | Pace & Space | Pace And Space | 65.1% | Mismatch |
| Houston Lightning | Balanced | Balanced | 65.1% | Yes |
| Nashville Stars | Post Centric | Balanced | 65.1% | Mismatch |
| Miami Cyclones | Morey Ball | Balanced | 63.9% | Mismatch |
| Chicago Jailbirds | Pace & Space | Pace And Space | 62.9% | Mismatch |
| Portland Lumberjacks | Balanced | Balanced | 62.9% | Yes |
| Toronto Huskies | Morey Ball | Morey Ball | 62.7% | Yes |
| Kansas City Knights | Morey Ball | Balanced | 62.1% | Mismatch |
| Dallas Predators | Balanced | Balanced | 61.4% | Yes |
| Salt Lake City Saints | Balanced | Balanced | 61.4% | Yes |
| San Diego Calaveras | Pace & Space | Pace And Space | 61.4% | Mismatch |
| Washington Pilots | Balanced | Balanced | 61.4% | Yes |
| Minneapolis Blizzards | Pace & Space | Pace And Space | 61.1% | Mismatch |
| Cincinnati Kings | Morey Ball | Morey Ball | 60.8% | Yes |
| New York Renegades | Morey Ball | Morey Ball | 60.2% | Yes |
| Phoenix Vultures | Morey Ball | Morey Ball | 60.2% | Yes |
| Los Angeles Fireballs | Pace & Space | Pace And Space | 60.0% | Mismatch |
| Indiana Stonecutters | Pace & Space | Pace And Space | 59.0% | Mismatch |
| Charlotte Drones | Triangle | Balanced | 58.8% | Mismatch |
| Louisville Colonels | Balanced | Balanced | 58.8% | Yes |
| Boston Crusaders | Morey Ball | Morey Ball | 58.4% | Yes |
| Oakland Tritons | Seven Seconds | Balanced | 57.8% | Mismatch |
| Vancouver Wolves | Pace & Space | Pace And Space | 57.3% | Mismatch |
| Seattle Thunder | Morey Ball | Pace And Space | 57.0% | Mismatch |
| Detroit Mustangs | Balanced | Morey Ball | 56.2% | Mismatch |
| Oklahoma City Barons | Balanced | Balanced | 55.6% | Yes |
| Philadelphia Warriors | Pace & Space | Balanced | 55.6% | Mismatch |
| Mexico City Jaguars | Morey Ball | Morey Ball | 55.4% | Yes |
| Baltimore Bullets | Balanced | Balanced | 55.1% | Yes |
| New Orleans Hurricanes | Morey Ball | Balanced | 50.0% | Mismatch |
| Pittsburgh Vipers | Balanced | Balanced | 49.4% | Yes |
| Denver Dragons | Balanced | Balanced | 35.4% | Yes |
Philosophy × Win% Correlation Strength
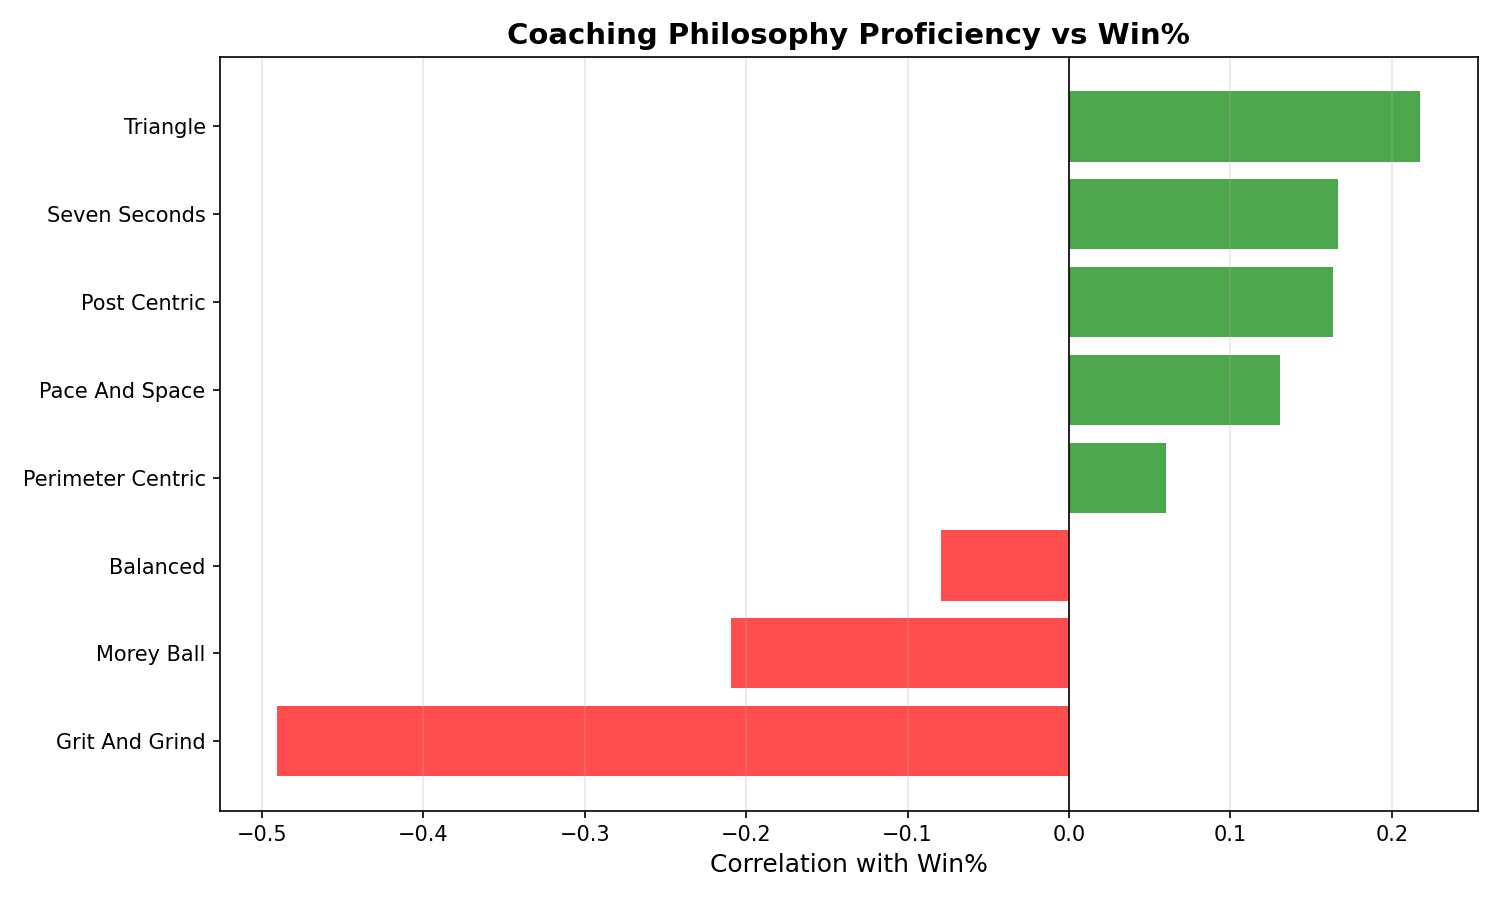
Pearson r between roster-derived philosophy proficiency and team win%. Pace & Space dominates.
Recommendation Summary
Actionable Recommendations
1
Strongest Correlation
N/A
Biggest Denver Gap
N/A
Archetype Priority
High Priority
3. Pop Specialist archetype has highest mean Impact (53.5).
Evidence: n=123, mean Impact=53.5
Example targets:
- Stanley Amakor
- Kavian Hawes
- Cedric Rodgers