2050 Draft Board

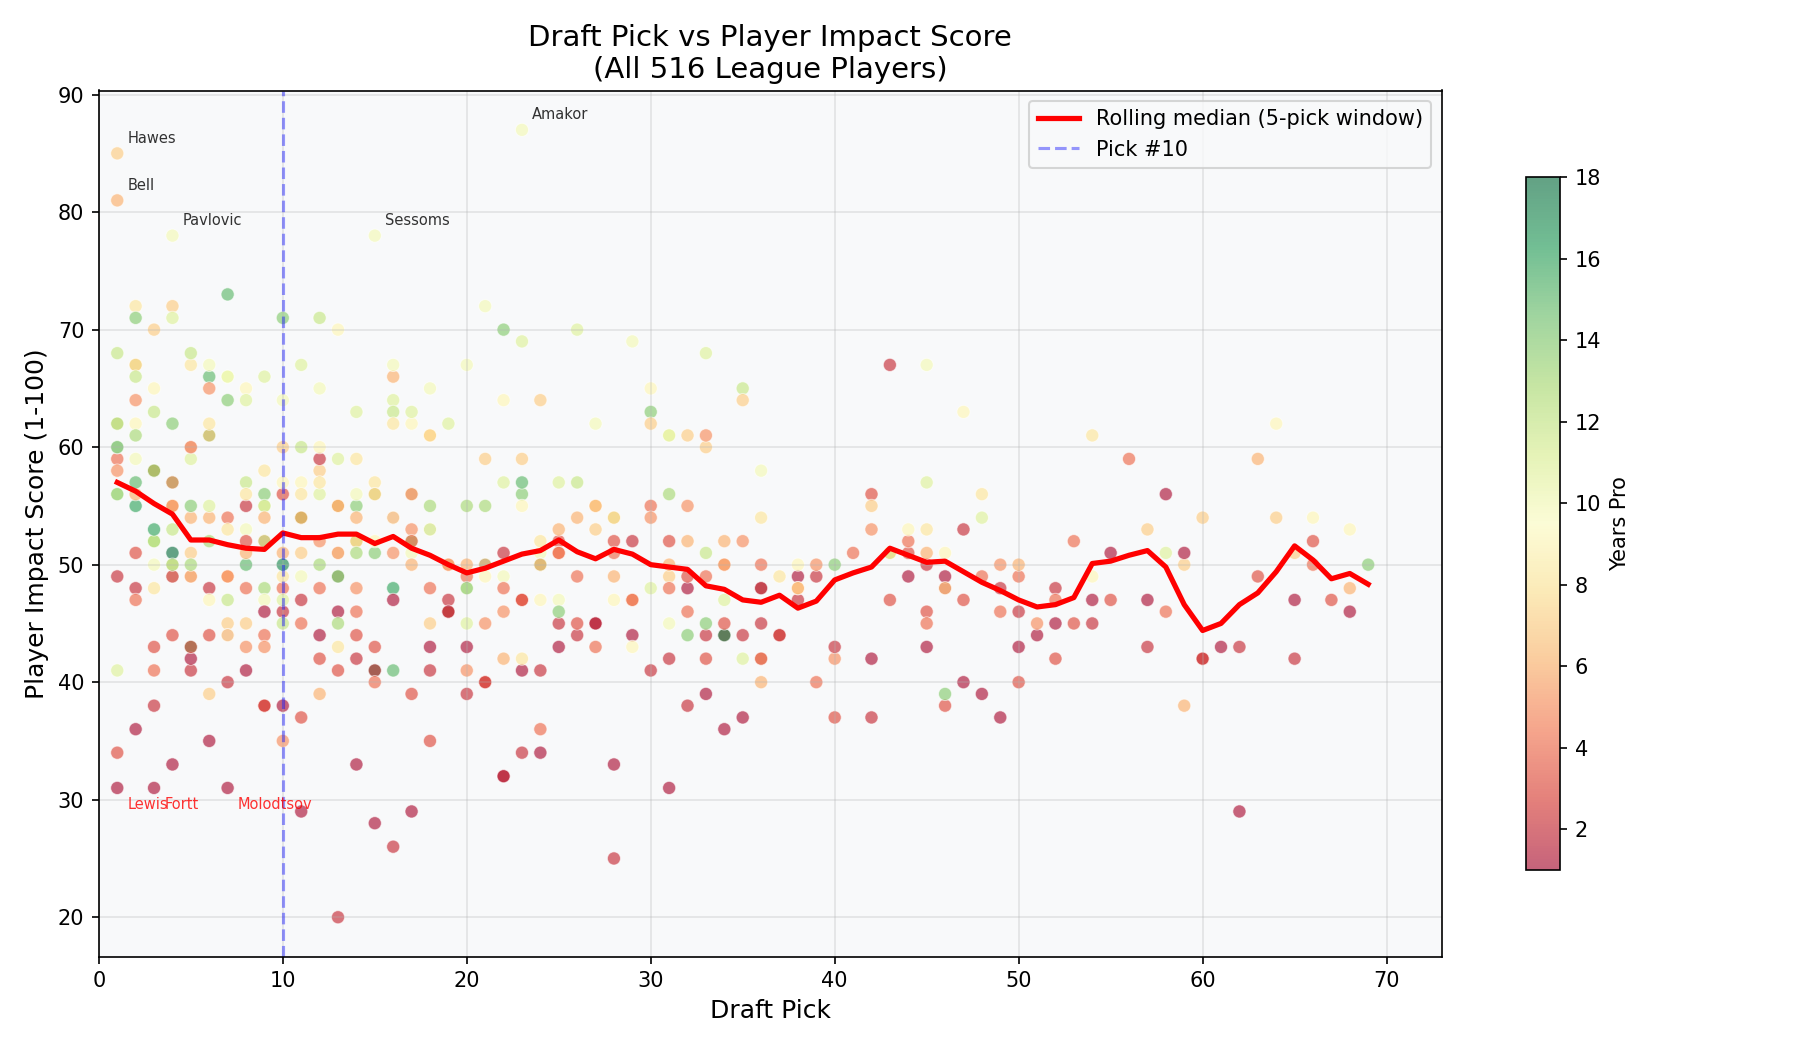
880 scraped prospects ranked by Win Value percentile (vs all pros + college) | Denver selected: Ackerman (#10), McGhie (#72)

Metrics Quick Reference
COLUMNWHAT IT MEANS
Win Value %Prospect's Player Win Value as a percentile vs all 516 current pros. Higher = more pro-ready talent. Based on 32 skill ratings weighted by win correlation (R2=0.642).
Positional BSIPosition-specific Box Score Impact projection using PG/SG/SF/PF/C-tuned coefficients. Higher = better projected impact for that position group. Green (40+) = strong positional fit. Orange (20-40) = average. Red (<20) = weak for position.
Peak Win ModelProjected peak Win Model score. Estimates how good a prospect will be at their ceiling, based on estimated PA + position + development trajectory.
PA EstEstimated Potential Ability (the game's hidden ceiling rating, 1-5 scale). Blended from Win Value trajectory analysis + Pro Potential scouting grade. 4.0+ = star upside, 3.0+ = solid starter.
DivPeak Win Model vs PA divergence. = win model ranks skills higher than PA suggests (often bigs). = PA sees more ceiling than skills project (often guards — potential development bet). Double arrows = strong divergence (≥15%).
MockAverage mock draft position across JD.Net, HP, and JSPN. Predicts where a player will be drafted, not how good they'll be.
Bal WVWin Value adjusted for Balanced offensive philosophy (Denver HC Carson Killingsworth). Applies empirically-derived multipliers to each skill coefficient based on how that skill correlates with Balanced system proficiency.

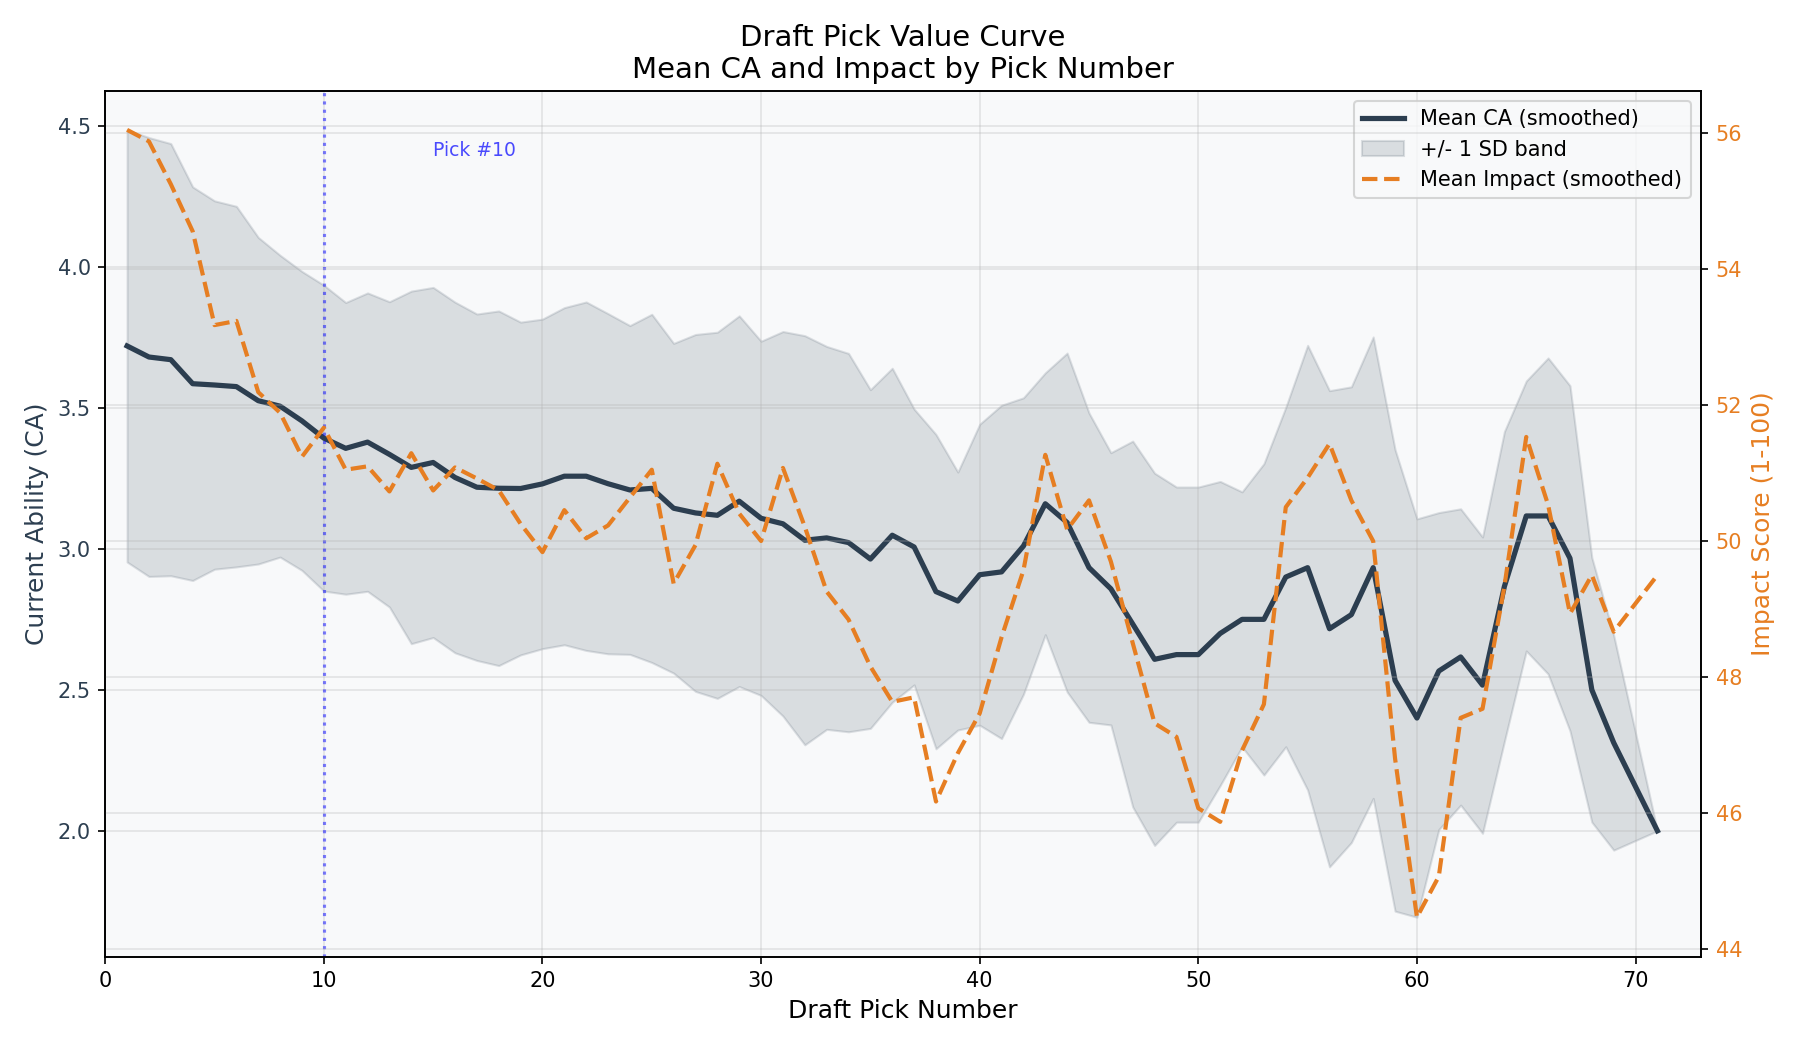
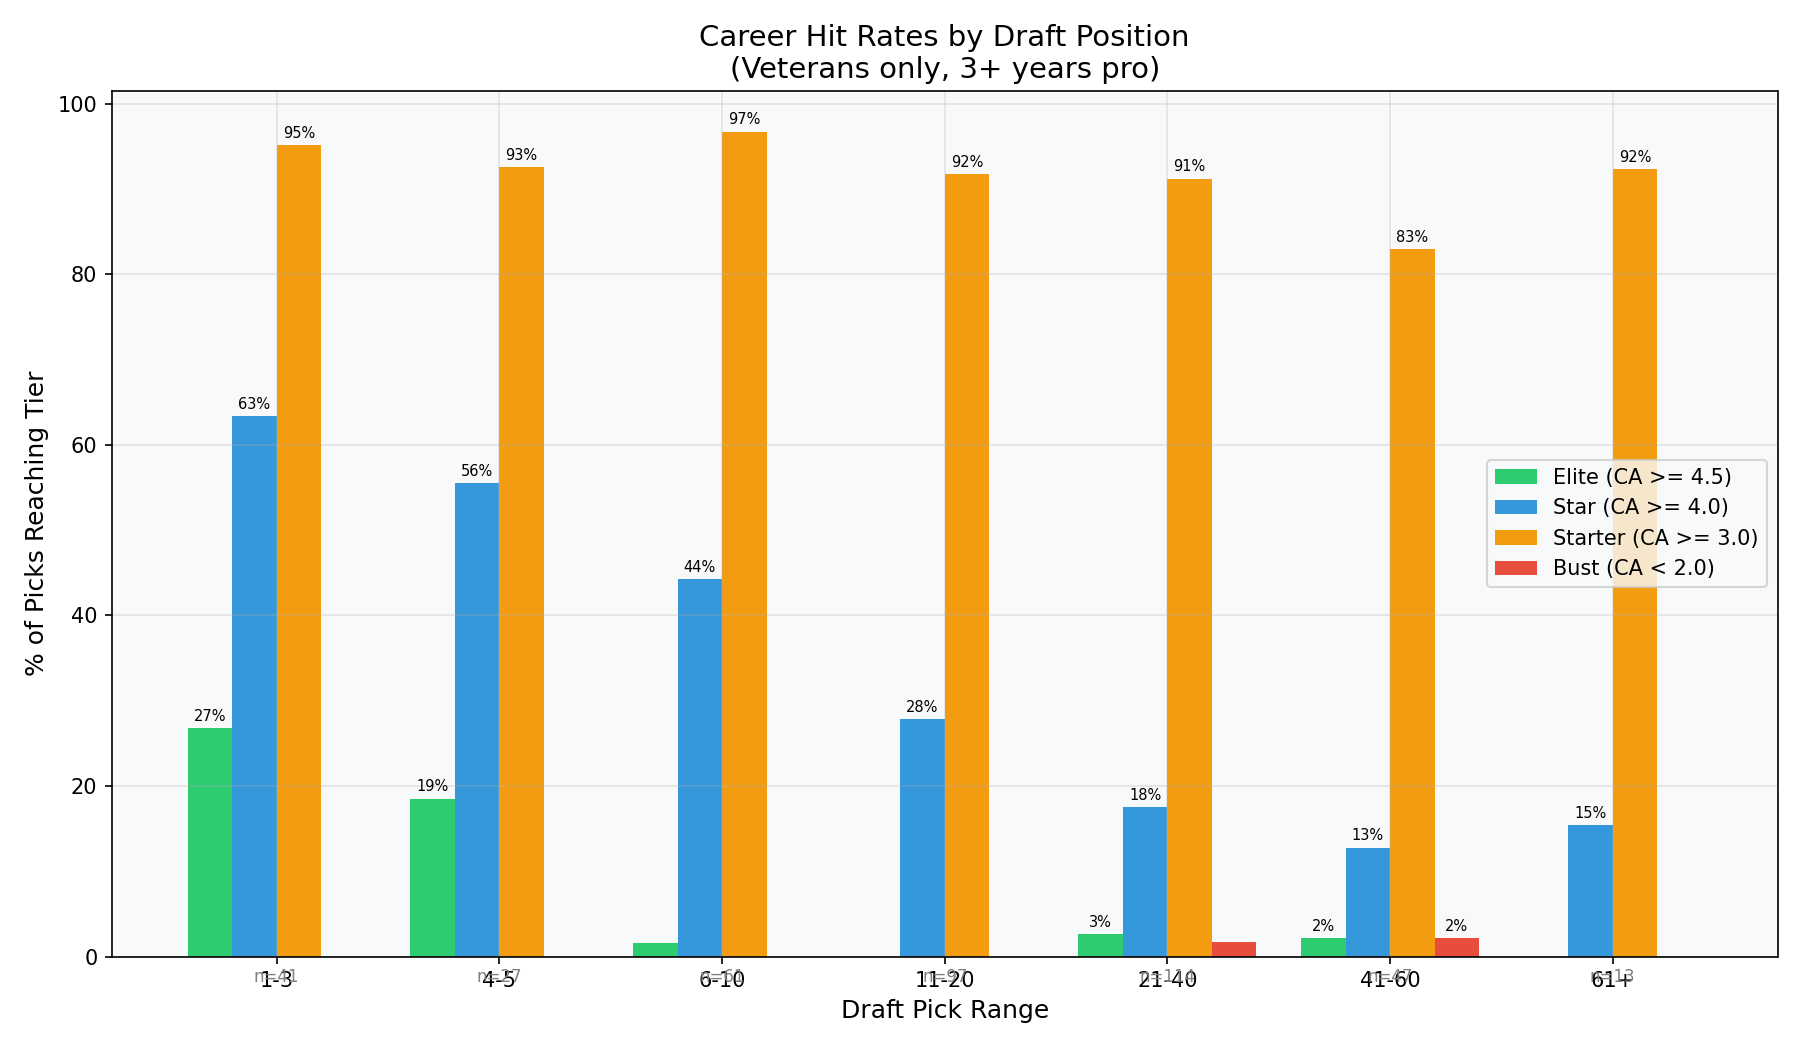
Historical draft pick outcomes across 437 drafted players | What should Denver expect at #10?

prospects | above average | Denver selected: Ackerman (#10), McGhie (#72)

DECISION TREE DRAFT RESULTS

Showing of matching prospects

96.4%
STAR RATE (PICKS 6-10)
CA >= 4.0
0.0%
BUST RATE (PICKS 6-10)
CA < 2.0
4.5
MEDIAN CA (PICKS 6-10)
n=55 veterans
100.0%
STARTER RATE (PICKS 6-10)
CA >= 3.0

Draft Value Analysis

Value Curve
Click to enlarge
Hit Rates by Range
Click to enlarge
Pick vs Impact
Click to enlarge

Value by Pick Range

RANGE N AVG CA AVG IMPACT STAR% BUST%
1-3 45 4.53 55.6 92.3% 0.0%
4-5 27 4.48 54.9 95.7% 0.0%
6-10 * 65 4.4 52.2 96.4% 0.0%
11-20 101 4.04 49.6 84.0% 0.0%
21-40 125 3.9 48.0 82.2% 0.0%
41-60 59 3.59 46.0 66.7% 0.0%
61+ 15 3.5 40.4 70.0% 0.0%
* Denver's pick range | Star = CA >= 4.0, Bust = CA < 2.0 | Veterans only (3+ yrs pro)

Historical Picks 8-12

# NAME TEAM CA PA IMPACT
8 Nazir Link * Austin Rockets 4.0 3.5 53
8 Dimitris Karras Charlotte Drones 4.0 4.0 45
8 Raekwon Pack Dallas Predators 5.0 4.0 61
8 Kel Pendergast Denver Dragons 4.5 4.0 55
8 Willie Bennett Las Vegas Scorpions 4.5 3.0 62
8 Terrence Swan Louisville Colonels 5.0 3.5 57
8 Vasja Delimont * Oakland Tritons 3.0 4.0 40
8 Leon Hawthorne Oklahoma City Barons 5.0 3.5 72
8 Devon Walton Philadelphia Warriors 4.5 3.0 52
8 Demitrius Waltz Phoenix Vultures 4.5 3.5 55
8 Isaac Lopez Portland Lumberjacks 4.0 2.5 46
8 Conner Pearson St Louis Skyhawks 5.0 4.0 52
8 Ambrose Udoh Toronto Huskies 5.0 4.0 52
9 Scoochie Hope Atlanta Devils 5.0 3.5 54
9 Keyon McCoy Charlotte Drones 4.5 3.5 52
9 René Köpke * Charlotte Drones 4.0 4.5 25
9 Ðorde Petrović Cleveland Giants 4.5 2.5 36
9 Kaimyn Fry Denver Dragons 4.0 3.0 35
9 Anthony Beamer Miami Cyclones 4.0 3.0 43
9 Stephan Rayner New York Renegades 4.5 3.0 51
9 Tre Braun Philadelphia Warriors 5.0 3.5 72
9 DJ McCants Phoenix Vultures 5.0 4.0 57
9 Jordan Kolaxis Phoenix Vultures 4.5 3.0 53
9 Kylian Fontaine * Phoenix Vultures 3.5 5.0 31
9 Jordan Johnson Jr Vancouver Wolves 4.5 3.0 42
10 Bogdan Nikolic Dallas Predators 4.5 3.0 43
10 Waylan Loftin Dallas Predators 4.0 4.5 73
10 Jamaya Patton Indiana Stonecutters 4.5 3.0 36
10 James Winters Kansas City Knights 5.0 3.5 49
10 Triston Dantley * Los Angeles Fireballs 4.0 5.0 44
10 Jamarcus Payne Minneapolis Blizzards 4.5 3.0 49
10 Anvar Makiev * Oakland Tritons 3.5 5.0 33
10 Marco De Luca Oklahoma City Barons 4.5 4.5 76
10 Xavier Lowe Philadelphia Warriors 4.5 3.5 66
10 Tra'Vaughn Tauaefa Philadelphia Warriors 4.0 3.0 52
10 Demitrius Burns Portland Lumberjacks 4.5 3.5 78
10 Evan Demery Washington Pilots 4.0 2.5 63
11 Cassius LeVert Baltimore Bullets 4.0 2.5 51
11 Adrian Schwartz Cleveland Giants 4.5 3.5 67
11 Garrick Jurkin Denver Dragons 5.0 3.5 59
11 LaMarcus Quinn * Denver Dragons 3.5 3.5 39
11 Leonardo Bianchi Houston Lightning 4.0 3.0 42
11 Detric Akenten Louisville Colonels 4.0 2.0 56
11 Kaan Korkmaz * Nashville Stars 3.5 4.0 21
11 Al-Amir Geyen New Orleans Hurricanes 4.0 3.0 43
11 Antonio Lopez New York Renegades 4.0 2.0 61
11 Landon Battier Oakland Tritons 5.0 3.5 68
11 Zion Buckner Philadelphia Warriors 4.5 3.0 52
11 Dejon Wright Phoenix Vultures 4.0 2.0 54
11 Lance Jacobsen Pittsburgh Vipers 4.0 2.0 47
12 Omari Swift Baltimore Bullets 3.5 3.0 32
12 Gage Woodward Chicago Jailbirds 4.5 3.5 49
12 McKinley Power * Cleveland Giants 3.5 5.0 47
12 Ruben Miramontes Kansas City Knights 4.5 3.5 60
12 DeLazarus Russell Las Vegas Scorpions 4.5 4.0 51
12 Guy Vasquez Los Angeles Fireballs 4.5 3.0 60
12 Lyles Heimuli * Miami Cyclones 3.0 4.0 44
12 Tiago Fernandes Nashville Stars 4.0 2.5 38
12 Tenzin Ozer Oklahoma City Barons 4.0 2.5 61
12 Mustapha Efianayi Pittsburgh Vipers 4.5 3.0 60
12 Jose Aguirre Portland Lumberjacks 3.5 3.0 47
12 Kostas Zonas Vancouver Wolves 5.0 5.0 75
* Young player (1-2 yrs pro) -- may not have reached peak

BEST VALUE PICKS

# NAME TEAM IMPACT SURPLUS
23 Stanley Amakor Chicago Jailbirds 90 +39
22 Cole Kopelani Mexico City Jaguars 86 +35
4 Veljko Pavlovic Oklahoma City Barons 87 +32
29 Austin Ross Baltimore Bullets 76 +25
15 Alzee Sessoms Cleveland Giants 77 +25
Impact far above draft slot expectation

BIGGEST MISSES

# NAME TEAM IMPACT DEFICIT
19 Sebastian Steinbach Denver Dragons 0 -52
55 Jamaree Dupay Chicago Jailbirds 0 -51
31 James Panzini Portland Lumberjacks 0 -51
1 Laurynas Linartas Atlanta Devils 29 -31
3 Jaleel Stripling Portland Lumberjacks 32 -28
Impact far below draft slot expectation

DENVER #10 IMPLICATIONS

Picks 6-10 have a 96.4% chance of producing a Star (CA 4.0+) and a 100.0% chance of producing a starter-caliber player.

Median outcome: CA 4.5 across 55 historical veterans.

Trading up (to 1-3): avg CA gain = +0.14

Trading down (to 11-20): avg CA loss = -0.28

Value curve is flat in 6-20 range -- trading down costs little in expected value while gaining additional assets.

No completed workouts yet.
No pending workouts. Add from the draft board table.

ADD PROSPECT TO WORKOUTS

No matching prospects
Workout list saved