
Cincinnati Kings
62-40 (60.8%)
PLAYOFF CONTENDER
Win Rank
18/36
PPG Scored
116.2
PPG Allowed
112.4
Pt Diff
+3.8
Trend
DECLINING
Scouting Radar
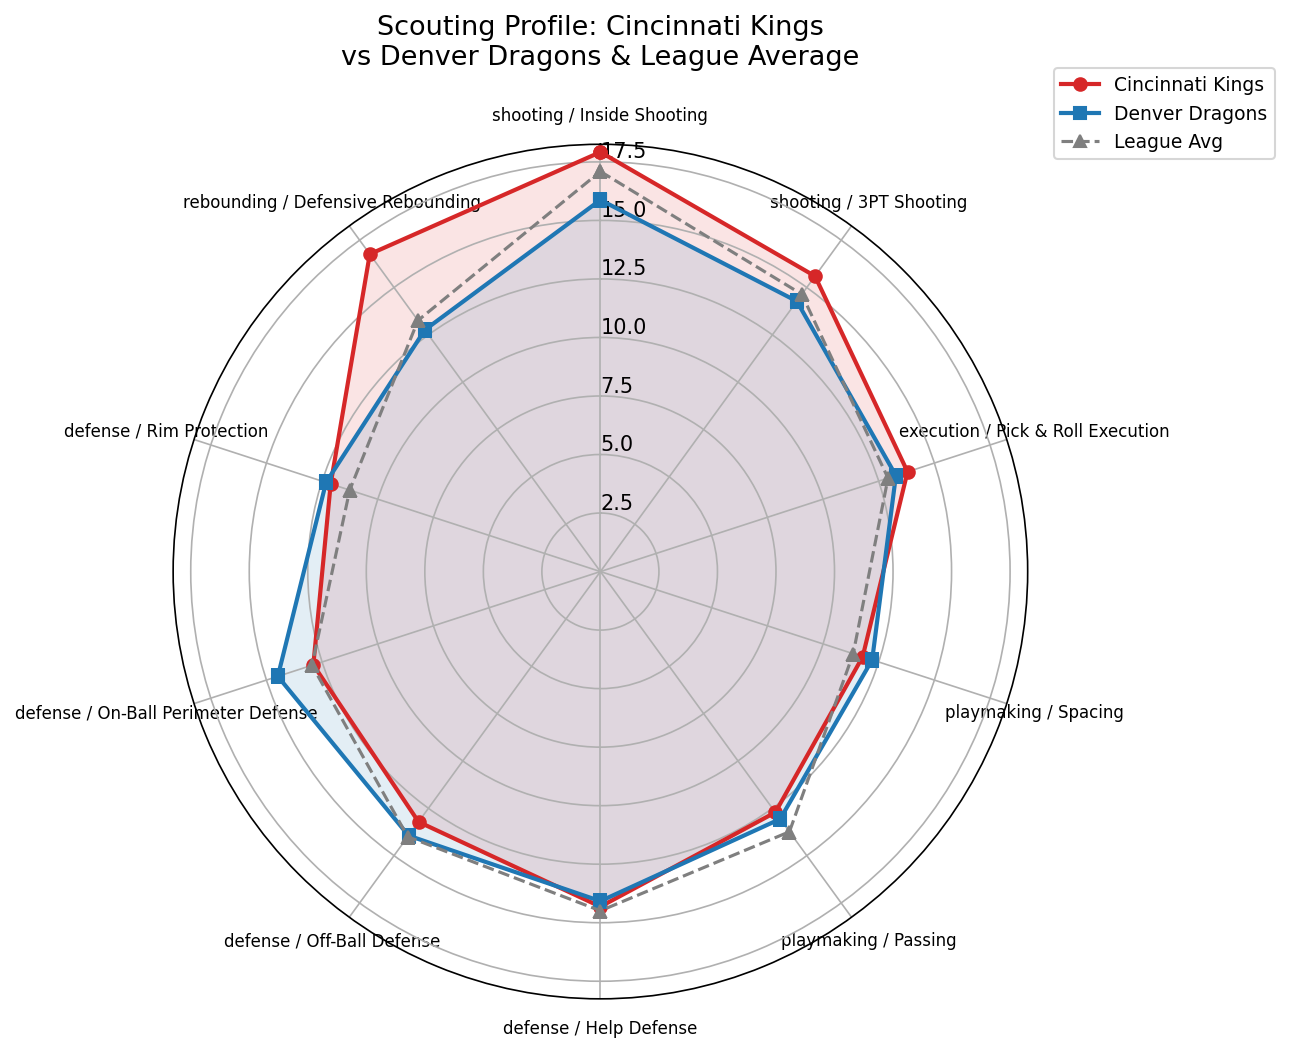
Offensive Profile
Morey Ball strong 3PT shooting team; strong inside scoring; elite PnR execution
System Proficiency
Morey Ball 20.0
Balanced 17.1
Pace & Space 13.8
Triangle 11.2
Inside Shooting
17.9
+0.8
3PT Shooting
15.6
+1.0
Pick & Roll Execution
13.8
+0.9
Spacing
11.8
+0.4
Passing
12.7
-1.0
Ball Handling
14.6
+2.1
Self-Creation
15.2
+0.6
Finishing
14.4
-0.7
Shoot Off Dribble
8.9
-1.3
Gravity
14.7
+1.1
Primary Scoring Options
Stephon Carlton
18.5 PPG | 20.0% USG | 67.1% TS | 0.0% 3P
Jacob Nazarian
17.5 PPG | 24.5% USG | 55.9% TS | 34.7% 3P
Russell Boozer
17.2 PPG | 21.8% USG | 62.1% TS | 37.4% 3P
Key Tendencies
Driving frequency:
39%
Defensive Profile
112.4 (rank 26/36)
Help Defense
14.3
-0.2
Off-Ball Defense
13.2
-0.8
On-Ball Perimeter Defense
12.9
-0.1
Rim Protection
12.1
+0.9
Defensive Rebounding
16.8
+3.5
Post Defense
10.4
-0.9
Stealing
13.6
+0.5
Defensive Archetypes
Wing Stopper x4
Helper x2
Anchor Big x1
Point Of Attack x1
Strengths & Weaknesses
Advantages
Strength
+3.76
Offensive Rebounding
+3.69
Defensive Rebounding
+3.50
Ball Handling
+2.07
Playmaking
+1.85
Athleticism
-1.41
Shoot Off Dribble
-1.28
Passing
-1.02
Post Defense
-0.90
Weaknesses
Athleticism
-1.41
Shoot Off Dribble
-1.28
Passing
-1.02
Post Defense
-0.90
Exploitable Matchups (Denver Advantage)
Athleticism
Opp 11.8 vs Den 14.8
+3.07
Shoot Off Dribble
Opp 8.9 vs Den 12.2
+3.36
Post Defense
Opp 10.4 vs Den 11.4
+1.00
Isolation Execution
Opp 13.6 vs Den 14.1
+0.50
Denver Game Plan
1. DEFEND THE ARC: Strong 3PT team (15.6 vs 14.6 lg avg). Close out hard on shooters, contest every three.
2. KEY ASSIGNMENT: Contain Stephon Carlton (18.5 PPG, 20.0% USG). Assign best perimeter defender, deny touches.
Denver Edges
Shoot Off Dribble
+3.36
On-Ball Perimeter Defense
+1.59
Post Defense
+1.00
Athleticism
+3.07
First Step
+1.10
Denver Disadvantages
Playmaking
-4.83
Offensive Rebounding
-4.71
Defensive Rebounding
-4.00
Foul Drawing
-3.81
Ball Handling
-2.49
Recommended Defensive Settings
Intensity
Conservative
Focus
Perimeter
Low
Guard Screen Def
Over
Big Screen Def
Drop
Press
Never
Zone
Never
Emphasis (Pick 2)
1.
Defensive Communication
PnR rating 13.8 (league avg 12.0)
2.
Challenge Every Shot
3PA 31.2/g (league avg 29.3)
Perimeter-heavy (3PT share 47%, 2PT share 53%)
Season Results
Home
45-37
Away
0-0
Last 10
5-5 (avg pt diff: -2.8)
Streak
W1
Best Win Streak
5
Worst Loss Streak
6
Matchup Adjustments
- ◆ Exploit Shoot Off Dribble: Denver 12 vs Opp 9 (+3 edge)
- ◆ Target Athleticism: Opp 12 (lg avg 13)
Depth Chart vs Cincinnati Kings
PG
Kel Pendergast
3.960
Hudson Leonard
3.697
Pedro Santos
Garrick Jurkin
SG
Garrick Jurkin
4.214
LaMarcus Quinn
3.202
Tyrae Lewis
Pedro Santos
SF
LaMarcus Quinn
3.202
Garrick Jurkin
4.214
Shaun Ackerman
Tyrae Lewis
PF
Devaugntah Litton
2.868
John Ford
3.458
Kaimyn Fry
Hudson Leonard
C
Kaimyn Fry
3.022
Devaugntah Litton
2.868
Robert Alcegaire
John Ford
24-Block Assignment
Each column = 2-minute game segment. Separators at Q1|Q2, Halftime, Q3|Q4. Letters show assigned position.
| Player | Pos | Min | 2 | 4 | 6 | 8 | 10 | 12 | Q2 | 14 | 16 | 18 | 20 | 22 | 24 | HT | 26 | 28 | 30 | 32 | 34 | 36 | Q4 | 38 | 40 | 42 | 44 | 46 | 48 |
|---|---|---|---|---|---|---|---|---|---|---|---|---|---|---|---|---|---|---|---|---|---|---|---|---|---|---|---|---|---|
| Garrick Jurkin (4.214 -0.020) | SF | 34 |
SF
|
SF
|
SG
|
PF
|
PG
|
PF
|
SG
|
SG
|
SG
|
SG
|
SG
|
PF
|
SG
|
PF
|
SG
|
SG
|
SG
|
||||||||||
| Kaimyn Fry (3.022 -0.020) | PF | 32 |
C
|
C
|
C
|
C
|
C
|
C
|
C
|
C
|
C
|
C
|
C
|
C
|
C
|
PF
|
PF
|
PF
|
|||||||||||
| Pedro Santos (4.242 -0.020) | SG | 28 |
SG
|
PG
|
SG
|
PG
|
PG
|
PG
|
SG
|
PG
|
SG
|
PG
|
PG
|
PG
|
PG
|
PG
|
|||||||||||||
| Tyrae Lewis (2.851 -0.020) | SG | 26 |
SF
|
SF
|
SF
|
SF
|
SF
|
SF
|
PG
|
PG
|
PG
|
SG
|
PG
|
SF
|
PG
|
||||||||||||||
| LaMarcus Quinn (3.202 -0.020) | SG | 24 |
SF
|
SF
|
SG
|
SF
|
PG
|
SF
|
SF
|
SF
|
SF
|
SF
|
SF
|
SF
|
|||||||||||||||
| Shaun Ackerman (3.092 -0.020) | SG | 24 |
PF
|
PF
|
PF
|
PF
|
SG
|
PF
|
PF
|
SG
|
PF
|
PG
|
SG
|
SG
|
|||||||||||||||
| Hudson Leonard (3.697 -0.020) | SG | 18 |
PG
|
PF
|
PF
|
PF
|
PF
|
PF
|
PG
|
SG
|
PF
|
||||||||||||||||||
| Kel Pendergast (3.960 -0.020) | SG | 14 |
PG
|
SF
|
SF
|
PG
|
SF
|
SF
|
SF
|
||||||||||||||||||||
| Robert Alcegaire (3.034 -0.020) | PF | 14 |
C
|
C
|
PF
|
C
|
C
|
C
|
C
|
||||||||||||||||||||
| Tyrique Beaudean (3.269 -0.020) | SG | 10 |
PG
|
SG
|
PG
|
SG
|
SG
|
||||||||||||||||||||||
| Devaugntah Litton (2.868 -0.020) | PF | 8 |
PF
|
PF
|
C
|
C
|
|||||||||||||||||||||||
| John Ford (3.458 -0.020) | PF | 8 |
C
|
C
|
C
|
PF
|
Minutes Distribution
240/240| Player | Pos | WV | Adj | Target | Blocks | Season MPG | Promise | END |
|---|---|---|---|---|---|---|---|---|
| Garrick Jurkin | SF | 4.214 | -0.020 | 34 | 34 | 31.5 | Starter | 19 |
| Kaimyn Fry | PF | 3.022 | -0.020 | 28 | 32 | 31.2 | Starter | 7 |
| Pedro Santos | SG | 4.242 | -0.020 | 50 | 28 | 29.7 | Starter | 15 |
| Tyrae Lewis | SG | 2.851 | -0.020 | 28 | 26 | 30.7 | Starter | 8 |
| LaMarcus Quinn | SG | 3.202 | -0.020 | 26 | 24 | 30.7 | Starter | 13 |
| Shaun Ackerman | SG | 3.092 | -0.020 | 22 | 24 | 0 | Deep | 17 |
| Hudson Leonard | SG | 3.697 | -0.020 | 12 | 18 | 13.6 | Bench | 16 |
| Kel Pendergast | SG | 3.960 | -0.020 | 14 | 14 | 16.7 | Bench | 15 |
| Robert Alcegaire | PF | 3.034 | -0.020 | 10 | 14 | 11.3 | Bench | 11 |
| Tyrique Beaudean | SG | 3.269 | -0.020 | 4 | 10 | 3.7 | Deep | 11 |
| Devaugntah Litton | PF | 2.868 | -0.020 | 6 | 8 | 6.5 | Deep | 10 |
| John Ford | PF | 3.458 | -0.020 | 6 | 8 | 5.5 | Deep | 18 |