
Kansas City Knights
64-39 (62.1%)
PLAYOFF CONTENDER
Win Rank
12/36
PPG Scored
115.8
PPG Allowed
113.0
Pt Diff
+2.8
Trend
IMPROVING
Scouting Radar
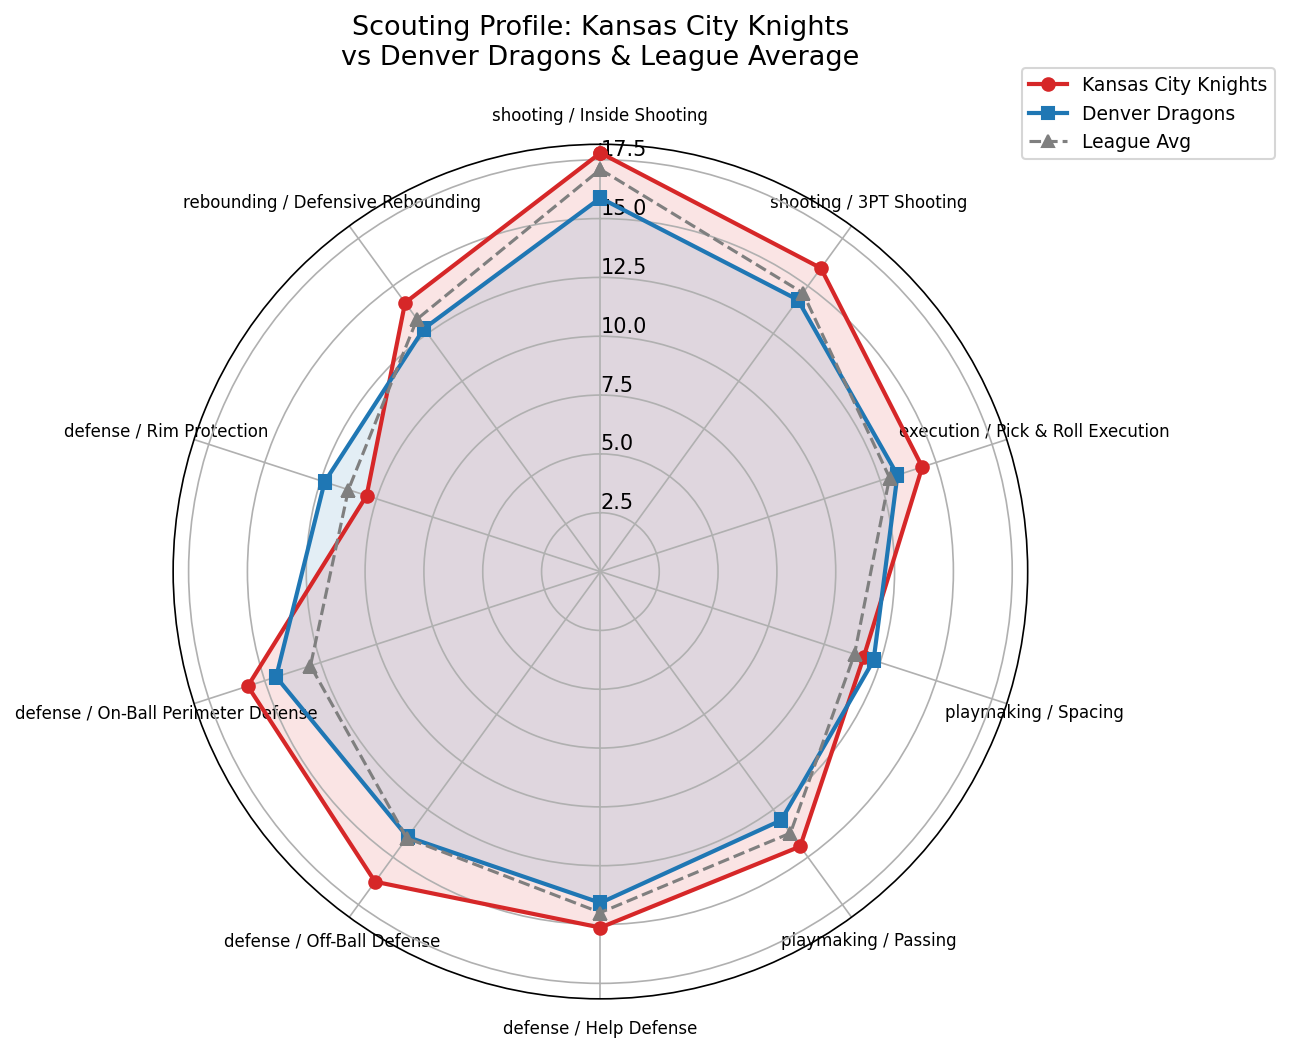
Offensive Profile
Balanced strong 3PT shooting team; strong inside scoring; elite PnR execution; drive-heavy
System Proficiency
Balanced 19.3
Morey Ball 19.0
Pace & Space 17.5
Grit & Grind 6.7
Inside Shooting
17.8
+0.7
3PT Shooting
15.9
+1.3
Pick & Roll Execution
14.4
+1.5
Spacing
11.8
+0.4
Passing
14.4
+0.7
Ball Handling
12.7
+0.2
Self-Creation
15.6
+1.0
Finishing
15.3
+0.2
Shoot Off Dribble
12.9
+2.8
Gravity
14.7
+1.0
Primary Scoring Options
Kavian Hawes
22.0 PPG | 26.7% USG | 69.3% TS | 43.8% 3P
Andre Griffin
15.6 PPG | 21.4% USG | 60.6% TS | 42.2% 3P
Zeke Barry
15.3 PPG | 19.6% USG | 65.4% TS | 32.4% 3P
Key Tendencies
Driving frequency:
68%
Defensive Profile
113.0 (rank 33/36)
Help Defense
15.1
+0.6
Off-Ball Defense
16.3
+2.3
On-Ball Perimeter Defense
15.8
+2.8
Rim Protection
10.4
-0.8
Defensive Rebounding
14.1
+0.9
Post Defense
13.8
+2.4
Stealing
15.5
+2.3
Defensive Archetypes
Wing Stopper x3
Mobile Big x2
Chaser x1
Point Of Attack x1
Strengths & Weaknesses
Advantages
Speed
+2.97
On-Ball Perimeter Defense
+2.80
Shoot Off Dribble
+2.78
Post Defense
+2.43
Stealing
+2.34
Ball Dominance
-1.14
Rim Protection
-0.81
Weaknesses
Ball Dominance
-1.14
Rim Protection
-0.81
Exploitable Matchups (Denver Advantage)
Rim Protection
Opp 10.4 vs Den 12.3
+1.88
Denver Game Plan
1. ATTACK THE RIM: Weak rim protection (10.4 vs 11.3 lg avg). Feed interior scorers and drive aggressively.
2. DEFEND THE ARC: Strong 3PT team (15.9 vs 14.6 lg avg). Close out hard on shooters, contest every three.
3. KEY ASSIGNMENT: Contain Kavian Hawes (22.0 PPG, 26.7% USG). Assign best perimeter defender, deny touches.
Denver Edges
Rim Protection
+1.88
Strength
+1.56
Denver Disadvantages
Playmaking
-4.98
Foul Drawing
-3.50
Post Execution
-3.34
Self-Creation
-2.51
Mid-Range Shooting
-2.46
Recommended Defensive Settings
Intensity
Conservative
Focus
Perimeter
Low
Guard Screen Def
Over
Big Screen Def
Drop
Press
Never
Zone
Never
Emphasis (Pick 2)
1.
Defensive Communication
PnR rating 14.4 (league avg 12.0)
2.
Challenge Every Shot
3PA 31.9/g (league avg 29.3)
Perimeter-heavy (3PT share 47%, 2PT share 53%)
Season Results
Home
48-34
Away
0-0
Last 10
6-4 (avg pt diff: +0.8)
Streak
W1
Best Win Streak
5
Worst Loss Streak
4
Matchup Adjustments
- ◆ Exploit Rim Protection: Denver 12 vs Opp 10 (+2 edge)
- ◆ Target Ball Dominance: Opp 13 (lg avg 14)
Depth Chart vs Kansas City Knights
PG
Kel Pendergast
3.973
Hudson Leonard
3.709
Pedro Santos
Garrick Jurkin
SG
Garrick Jurkin
4.233
LaMarcus Quinn
3.209
Tyrae Lewis
Pedro Santos
SF
LaMarcus Quinn
3.209
Garrick Jurkin
4.233
Shaun Ackerman
Tyrae Lewis
PF
Devaugntah Litton
2.882
John Ford
3.476
Kaimyn Fry
Hudson Leonard
C
Kaimyn Fry
3.039
Devaugntah Litton
2.882
Robert Alcegaire
John Ford
24-Block Assignment
Each column = 2-minute game segment. Separators at Q1|Q2, Halftime, Q3|Q4. Letters show assigned position.
| Player | Pos | Min | 2 | 4 | 6 | 8 | 10 | 12 | Q2 | 14 | 16 | 18 | 20 | 22 | 24 | HT | 26 | 28 | 30 | 32 | 34 | 36 | Q4 | 38 | 40 | 42 | 44 | 46 | 48 |
|---|---|---|---|---|---|---|---|---|---|---|---|---|---|---|---|---|---|---|---|---|---|---|---|---|---|---|---|---|---|
| Garrick Jurkin (4.233 -0.001) | SF | 40 |
PG
|
SF
|
PF
|
SF
|
PF
|
SG
|
SF
|
SF
|
SF
|
PF
|
SF
|
SG
|
SG
|
SG
|
PF
|
SF
|
SG
|
SF
|
SF
|
SF
|
|||||||
| Kaimyn Fry (3.039 -0.003) | PF | 32 |
C
|
C
|
C
|
C
|
C
|
C
|
C
|
C
|
C
|
C
|
PF
|
C
|
C
|
PF
|
PF
|
PF
|
|||||||||||
| Pedro Santos (4.265 +0.003) | SG | 28 |
SG
|
SG
|
SG
|
SG
|
SG
|
SG
|
SG
|
SG
|
SG
|
SG
|
PG
|
SG
|
SG
|
SG
|
|||||||||||||
| LaMarcus Quinn (3.209 -0.013) | SG | 24 |
SF
|
SG
|
SF
|
SF
|
SF
|
SF
|
SF
|
PG
|
SF
|
PG
|
SF
|
SF
|
|||||||||||||||
| Shaun Ackerman (3.103 -0.009) | SG | 24 |
PF
|
PF
|
PF
|
PG
|
PF
|
PF
|
PF
|
PF
|
SF
|
PF
|
PG
|
PF
|
|||||||||||||||
| Tyrae Lewis (2.862 -0.009) | SG | 24 |
SF
|
SG
|
SG
|
PG
|
SG
|
PG
|
PG
|
SF
|
PG
|
SG
|
SF
|
SF
|
|||||||||||||||
| Kel Pendergast (3.973 -0.007) | SG | 16 |
PG
|
PG
|
PG
|
PG
|
SG
|
PG
|
PG
|
PG
|
|||||||||||||||||||
| Hudson Leonard (3.709 -0.008) | SG | 16 |
PF
|
PG
|
PF
|
PG
|
PG
|
PF
|
PG
|
PG
|
|||||||||||||||||||
| Devaugntah Litton (2.882 -0.006) | PF | 12 |
PF
|
PF
|
C
|
C
|
C
|
PF
|
|||||||||||||||||||||
| John Ford (3.476 -0.002) | PF | 10 |
PF
|
C
|
C
|
C
|
C
|
||||||||||||||||||||||
| Robert Alcegaire (3.052 -0.002) | PF | 10 |
C
|
C
|
C
|
C
|
C
|
||||||||||||||||||||||
| Tyrique Beaudean (3.279 -0.010) | SG | 4 |
PG
|
PG
|
Minutes Distribution
240/240| Player | Pos | WV | Adj | Target | Blocks | Season MPG | Promise | END |
|---|---|---|---|---|---|---|---|---|
| Garrick Jurkin | SF | 4.233 | -0.001 | 42 | 40 | 31.5 | Starter | 19 |
| Kaimyn Fry | PF | 3.039 | -0.003 | 32 | 32 | 31.2 | Starter | 7 |
| Pedro Santos | SG | 4.265 | +0.003 | 30 | 28 | 29.7 | Starter | 15 |
| LaMarcus Quinn | SG | 3.209 | -0.013 | 28 | 24 | 30.7 | Starter | 13 |
| Shaun Ackerman | SG | 3.103 | -0.009 | 22 | 24 | 0 | Deep | 17 |
| Tyrae Lewis | SG | 2.862 | -0.009 | 28 | 24 | 30.7 | Starter | 8 |
| Kel Pendergast | SG | 3.973 | -0.007 | 16 | 16 | 16.7 | Bench | 15 |
| Hudson Leonard | SG | 3.709 | -0.008 | 14 | 16 | 13.6 | Bench | 16 |
| Devaugntah Litton | PF | 2.882 | -0.006 | 6 | 12 | 6.5 | Deep | 10 |
| John Ford | PF | 3.476 | -0.002 | 6 | 10 | 5.5 | Deep | 18 |
| Robert Alcegaire | PF | 3.052 | -0.002 | 12 | 10 | 11.3 | Bench | 11 |
| Tyrique Beaudean | SG | 3.279 | -0.010 | 4 | 4 | 3.7 | Deep | 11 |