
Miami Cyclones
53-30 (63.9%)
PLAYOFF CONTENDER
Win Rank
8/36
PPG Scored
112.9
PPG Allowed
107.7
Pt Diff
+5.2
Trend
IMPROVING
Scouting Radar
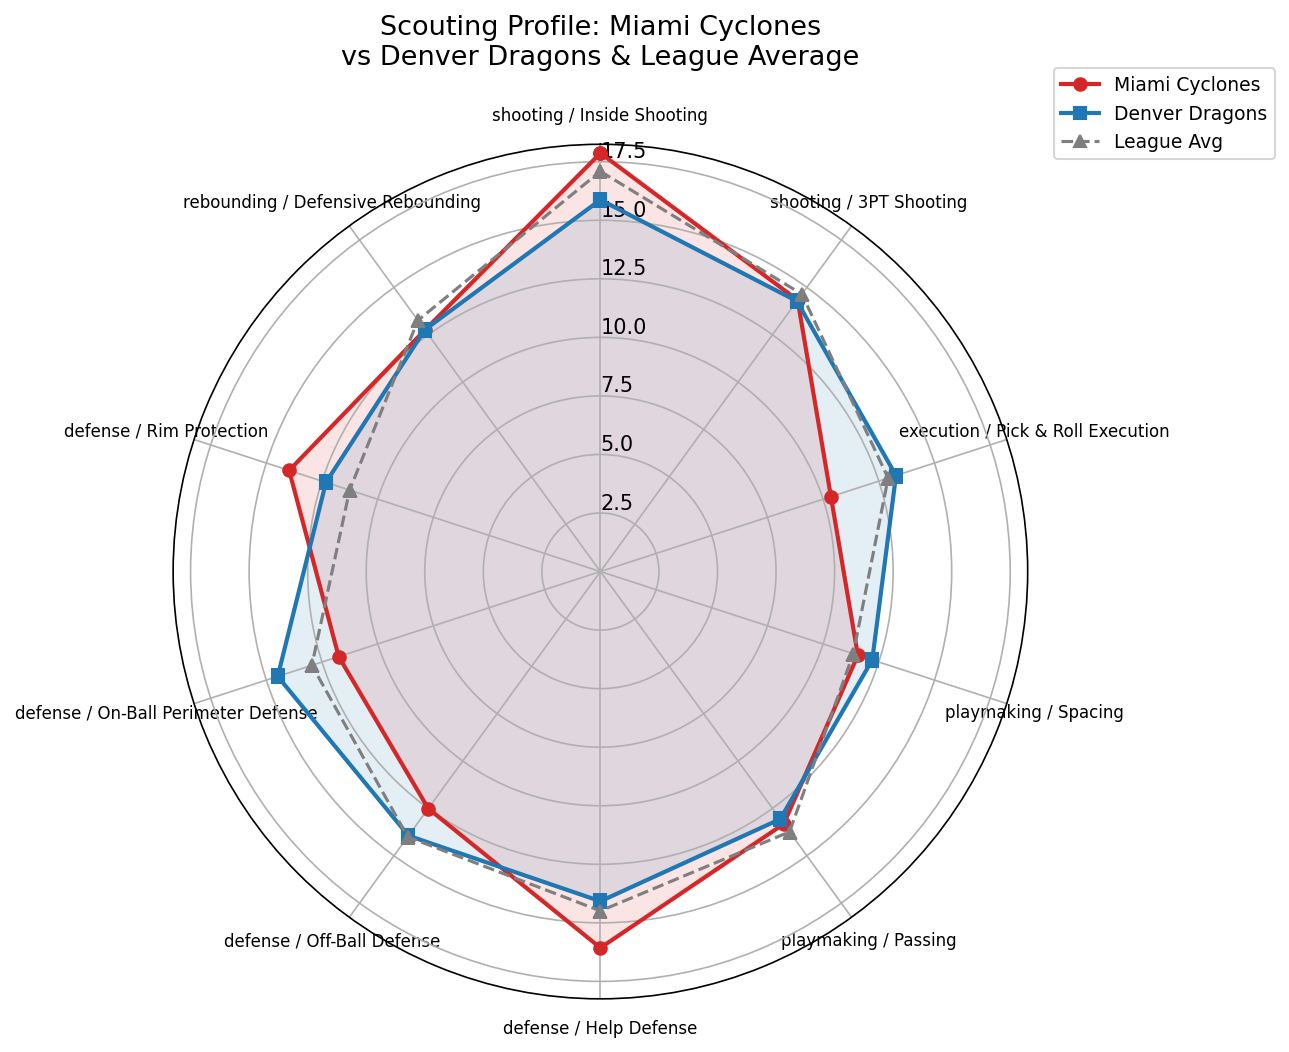
Offensive Profile
Balanced strong inside scoring
System Proficiency
Balanced 20.0
Morey Ball 16.0
Pace & Space 11.9
Post Centric 5.1
Inside Shooting
17.9
+0.8
3PT Shooting
14.3
-0.3
Pick & Roll Execution
10.3
-2.6
Spacing
11.6
+0.2
Passing
13.3
-0.4
Ball Handling
11.0
-1.5
Self-Creation
13.7
-1.0
Finishing
13.7
-1.5
Shoot Off Dribble
8.6
-1.5
Gravity
13.0
-0.7
Primary Scoring Options
Ervin Rhinehart
19.7 PPG | 25.8% USG | 59.7% TS | 44.2% 3P
Antoine Daniels
15.8 PPG | 29.5% USG | 56.5% TS | 37.9% 3P
Anthony Beamer
14.4 PPG | 22.8% USG | 50.8% TS | 30.6% 3P
Key Tendencies
Driving frequency:
50%
Defensive Profile
107.7 (rank 4/36)
Help Defense
16.1
+1.6
Off-Ball Defense
12.5
-1.5
On-Ball Perimeter Defense
11.8
-1.2
Rim Protection
14.0
+2.7
Defensive Rebounding
12.8
-0.5
Post Defense
12.9
+1.6
Stealing
14.2
+1.1
Defensive Archetypes
Wing Stopper x6
Mobile Big x2
Anchor Big x1
Point Of Attack x1
Strengths & Weaknesses
Advantages
Rim Protection
+2.72
Strength
+2.52
Help Defense
+1.58
Post Defense
+1.56
First Step
-3.67
Pick & Roll Execution
-2.57
Endurance
-2.52
Speed
-2.04
Shoot Off Dribble
-1.53
Weaknesses
First Step
-3.67
Pick & Roll Execution
-2.57
Endurance
-2.52
Speed
-2.04
Shoot Off Dribble
-1.53
Exploitable Matchups (Denver Advantage)
First Step
Opp 8.2 vs Den 13.7
+5.49
Pick & Roll Execution
Opp 10.3 vs Den 13.3
+2.92
Endurance
Opp 8.6 vs Den 12.8
+4.20
Speed
Opp 9.5 vs Den 13.0
+3.50
Shoot Off Dribble
Opp 8.6 vs Den 12.2
+3.61
On-Ball Perimeter Defense
Opp 11.8 vs Den 14.5
+2.74
Denver Game Plan
1. ISO OPPORTUNITIES: Weak perimeter defense (11.8 vs 13.0 lg avg). Let wing creators attack 1-on-1.
2. CRASH THE BOARDS: Poor defensive rebounding (12.7 vs 13.3 lg avg). Send offensive rebounders for second-chance points.
3. KEY ASSIGNMENT: Contain Ervin Rhinehart (19.7 PPG, 25.8% USG). Assign best perimeter defender, deny touches.
Denver Edges
Shoot Off Dribble
+3.61
Off-Ball Defense
+1.44
On-Ball Perimeter Defense
+2.74
Pick & Roll Execution
+2.92
Athleticism
+2.16
Denver Disadvantages
Post Execution
-4.87
Foul Drawing
-3.18
Mid-Range Shooting
-2.39
Inside Shooting
-1.99
Help Defense
-1.99
Recommended Defensive Settings
Intensity
Conservative
Focus
Balanced
Low
Guard Screen Def
Under
Big Screen Def
Drop
Press
Never
Zone
Never
Emphasis (Pick 2)
1.
Protect The Rim
2PT scoring share 55% (league avg 50%)
2.
Box Out
Default conservative choice
Dual threat — strong inside (55%) and outside (45%)
Season Results
Home
52-30
Away
0-0
Last 10
7-3 (avg pt diff: +6.4)
Streak
W1
Best Win Streak
7
Worst Loss Streak
4
Matchup Adjustments
- ◆ Exploit First Step: Denver 14 vs Opp 8 (+5 edge)
- ◆ Target First Step: Opp 8 (lg avg 12)
Depth Chart vs Miami Cyclones
PG
Kel Pendergast
3.960
Hudson Leonard
3.697
Pedro Santos
Garrick Jurkin
SG
Garrick Jurkin
4.214
LaMarcus Quinn
3.202
Tyrae Lewis
Pedro Santos
SF
LaMarcus Quinn
3.202
Garrick Jurkin
4.214
Shaun Ackerman
Tyrae Lewis
PF
Devaugntah Litton
2.868
John Ford
3.458
Kaimyn Fry
Hudson Leonard
C
Kaimyn Fry
3.022
Devaugntah Litton
2.868
Robert Alcegaire
John Ford
24-Block Assignment
Each column = 2-minute game segment. Separators at Q1|Q2, Halftime, Q3|Q4. Letters show assigned position.
| Player | Pos | Min | 2 | 4 | 6 | 8 | 10 | 12 | Q2 | 14 | 16 | 18 | 20 | 22 | 24 | HT | 26 | 28 | 30 | 32 | 34 | 36 | Q4 | 38 | 40 | 42 | 44 | 46 | 48 |
|---|---|---|---|---|---|---|---|---|---|---|---|---|---|---|---|---|---|---|---|---|---|---|---|---|---|---|---|---|---|
| Garrick Jurkin (4.214 -0.020) | SF | 34 |
SF
|
SF
|
SG
|
PF
|
PG
|
PF
|
SG
|
SG
|
SG
|
SG
|
SG
|
PF
|
SG
|
PF
|
SG
|
SG
|
SG
|
||||||||||
| Kaimyn Fry (3.022 -0.020) | PF | 32 |
C
|
C
|
C
|
C
|
C
|
C
|
C
|
C
|
C
|
C
|
C
|
C
|
C
|
PF
|
PF
|
PF
|
|||||||||||
| Pedro Santos (4.242 -0.020) | SG | 28 |
SG
|
PG
|
SG
|
PG
|
PG
|
PG
|
SG
|
PG
|
SG
|
PG
|
PG
|
PG
|
PG
|
PG
|
|||||||||||||
| Tyrae Lewis (2.851 -0.020) | SG | 26 |
SF
|
SF
|
SF
|
SF
|
SF
|
SF
|
PG
|
PG
|
PG
|
SG
|
PG
|
SF
|
PG
|
||||||||||||||
| LaMarcus Quinn (3.202 -0.020) | SG | 24 |
SF
|
SF
|
SG
|
SF
|
PG
|
SF
|
SF
|
SF
|
SF
|
SF
|
SF
|
SF
|
|||||||||||||||
| Shaun Ackerman (3.092 -0.020) | SG | 24 |
PF
|
PF
|
PF
|
PF
|
SG
|
PF
|
PF
|
SG
|
PF
|
PG
|
SG
|
SG
|
|||||||||||||||
| Hudson Leonard (3.697 -0.020) | SG | 18 |
PG
|
PF
|
PF
|
PF
|
PF
|
PF
|
PG
|
SG
|
PF
|
||||||||||||||||||
| Kel Pendergast (3.960 -0.020) | SG | 14 |
PG
|
SF
|
SF
|
PG
|
SF
|
SF
|
SF
|
||||||||||||||||||||
| Robert Alcegaire (3.034 -0.020) | PF | 14 |
C
|
C
|
PF
|
C
|
C
|
C
|
C
|
||||||||||||||||||||
| Tyrique Beaudean (3.269 -0.020) | SG | 10 |
PG
|
SG
|
PG
|
SG
|
SG
|
||||||||||||||||||||||
| Devaugntah Litton (2.868 -0.020) | PF | 8 |
PF
|
PF
|
C
|
C
|
|||||||||||||||||||||||
| John Ford (3.458 -0.020) | PF | 8 |
C
|
C
|
C
|
PF
|
Minutes Distribution
240/240| Player | Pos | WV | Adj | Target | Blocks | Season MPG | Promise | END |
|---|---|---|---|---|---|---|---|---|
| Garrick Jurkin | SF | 4.214 | -0.020 | 34 | 34 | 31.5 | Starter | 19 |
| Kaimyn Fry | PF | 3.022 | -0.020 | 28 | 32 | 31.2 | Starter | 7 |
| Pedro Santos | SG | 4.242 | -0.020 | 50 | 28 | 29.7 | Starter | 15 |
| Tyrae Lewis | SG | 2.851 | -0.020 | 28 | 26 | 30.7 | Starter | 8 |
| LaMarcus Quinn | SG | 3.202 | -0.020 | 26 | 24 | 30.7 | Starter | 13 |
| Shaun Ackerman | SG | 3.092 | -0.020 | 22 | 24 | 0 | Deep | 17 |
| Hudson Leonard | SG | 3.697 | -0.020 | 12 | 18 | 13.6 | Bench | 16 |
| Kel Pendergast | SG | 3.960 | -0.020 | 14 | 14 | 16.7 | Bench | 15 |
| Robert Alcegaire | PF | 3.034 | -0.020 | 10 | 14 | 11.3 | Bench | 11 |
| Tyrique Beaudean | SG | 3.269 | -0.020 | 4 | 10 | 3.7 | Deep | 11 |
| Devaugntah Litton | PF | 2.868 | -0.020 | 6 | 8 | 6.5 | Deep | 10 |
| John Ford | PF | 3.458 | -0.020 | 6 | 8 | 5.5 | Deep | 18 |