
Nashville Stars
54-29 (65.1%)
ELITE CONTENDER
Win Rank
6/36
PPG Scored
108.0
PPG Allowed
102.3
Pt Diff
+5.7
Trend
STABLE
Scouting Radar
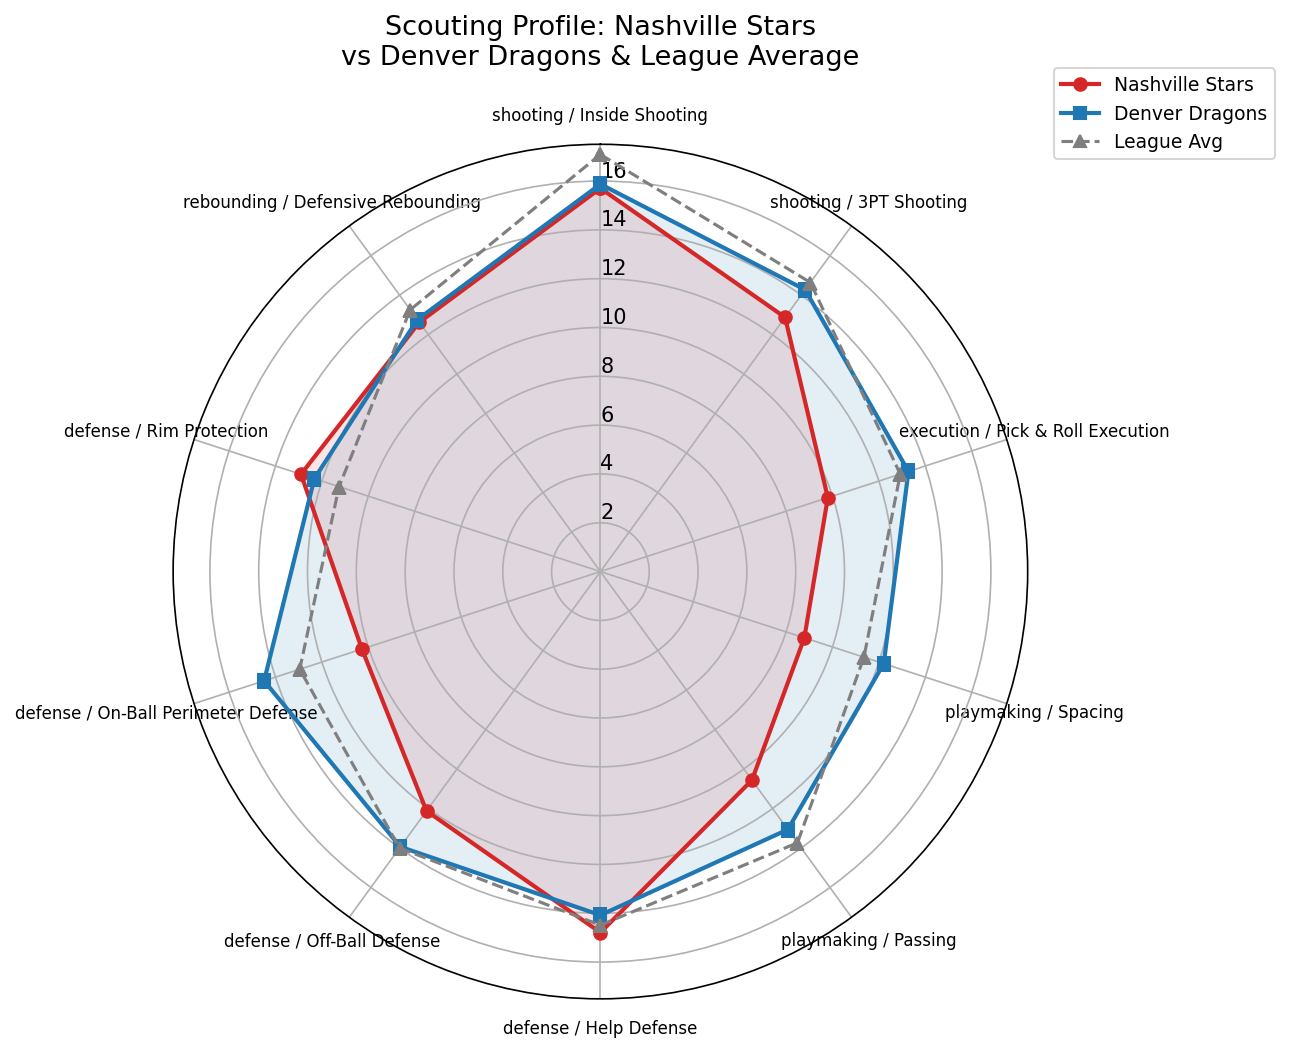
Offensive Profile
Balanced poor spacing (exploitable); drive-heavy
System Proficiency
Balanced 15.4
Morey Ball 11.8
Pace & Space 9.5
Post Centric 5.8
Inside Shooting
15.7
-1.4
3PT Shooting
12.9
-1.8
Pick & Roll Execution
9.8
-3.1
Spacing
8.8
-2.6
Passing
10.6
-3.2
Ball Handling
10.9
-1.7
Self-Creation
13.3
-1.3
Finishing
14.3
-0.8
Shoot Off Dribble
5.6
-4.5
Gravity
11.1
-2.5
Primary Scoring Options
Kaan Korkmaz
14.7 PPG | 27.6% USG | 54.0% TS | 32.1% 3P
KJ Martin
12.1 PPG | 22.3% USG | 63.1% TS | 47.5% 3P
Kinard Otero
11.2 PPG | 20.4% USG | 55.0% TS | 33.3% 3P
Key Tendencies
Driving frequency:
59%
Defensive Profile
102.3 (rank 2/36)
Help Defense
14.8
+0.3
Off-Ball Defense
12.1
-1.9
On-Ball Perimeter Defense
10.3
-2.7
Rim Protection
12.9
+1.6
Defensive Rebounding
12.6
-0.6
Post Defense
14.4
+3.1
Stealing
12.2
-1.0
Defensive Archetypes
Wing Stopper x4
Anchor Big x2
Mobile Big x2
Helper x1
Strengths & Weaknesses
Advantages
Post Defense
+3.09
Rim Protection
+1.64
Help Defense
+0.30
Athleticism
+0.10
Shoot Off Dribble
-4.54
Ball Dominance
-3.41
Passing
-3.17
Pick & Roll Execution
-3.12
On-Ball Perimeter Defense
-2.68
Weaknesses
Shoot Off Dribble
-4.54
Ball Dominance
-3.41
Passing
-3.17
Pick & Roll Execution
-3.12
On-Ball Perimeter Defense
-2.68
Exploitable Matchups (Denver Advantage)
Shoot Off Dribble
Opp 5.6 vs Den 12.2
+6.62
Pick & Roll Execution
Opp 9.8 vs Den 13.3
+3.47
On-Ball Perimeter Defense
Opp 10.3 vs Den 14.5
+4.21
Spacing
Opp 8.8 vs Den 12.2
+3.42
Denver Game Plan
1. ISO OPPORTUNITIES: Weak perimeter defense (10.3 vs 13.0 lg avg). Let wing creators attack 1-on-1.
2. CRASH THE BOARDS: Poor defensive rebounding (12.6 vs 13.3 lg avg). Send offensive rebounders for second-chance points.
3. PACK THE PAINT: Weak 3PT shooting (12.9 vs 14.6 lg avg). Sag off non-shooters and clog driving lanes.
4. CROWD THE LANE: Poor spacing (8.8 vs 11.4 lg avg). Play aggressive help defense — their shooters won't punish you.
Denver Edges
Ball Dominance
+1.62
Shoot Off Dribble
+6.62
Off-Ball Defense
+1.82
On-Ball Perimeter Defense
+4.21
Stealing
+1.73
Denver Disadvantages
Post Defense
-2.99
Foul Drawing
-2.86
Post Execution
-1.93
Playmaking
-1.41
Recommended Defensive Settings
Intensity
Conservative
Focus
Perimeter
Low
Guard Screen Def
Under
Big Screen Def
Drop
Press
Never
Zone
Never
Emphasis (Pick 2)
1.
Protect The Rim
2PT scoring share 55% (league avg 50%)
2.
Box Out
Default conservative choice
Perimeter-heavy (3PT share 45%, 2PT share 55%)
Season Results
Home
53-29
Away
0-0
Last 10
5-5 (avg pt diff: -0.2)
Streak
W1
Best Win Streak
6
Worst Loss Streak
3
Matchup Adjustments
- ◆ Exploit Shoot Off Dribble: Denver 12 vs Opp 6 (+7 edge)
- ◆ Target Shoot Off Dribble: Opp 6 (lg avg 10)
Depth Chart vs Nashville Stars
PG
Kel Pendergast
3.964
Hudson Leonard
3.703
Pedro Santos
Garrick Jurkin
SG
Garrick Jurkin
4.224
LaMarcus Quinn
3.207
Tyrae Lewis
Pedro Santos
SF
LaMarcus Quinn
3.207
Garrick Jurkin
4.224
Shaun Ackerman
Tyrae Lewis
PF
Devaugntah Litton
2.873
John Ford
3.465
Kaimyn Fry
Hudson Leonard
C
Kaimyn Fry
3.025
Devaugntah Litton
2.873
Robert Alcegaire
John Ford
24-Block Assignment
Each column = 2-minute game segment. Separators at Q1|Q2, Halftime, Q3|Q4. Letters show assigned position.
| Player | Pos | Min | 2 | 4 | 6 | 8 | 10 | 12 | Q2 | 14 | 16 | 18 | 20 | 22 | 24 | HT | 26 | 28 | 30 | 32 | 34 | 36 | Q4 | 38 | 40 | 42 | 44 | 46 | 48 |
|---|---|---|---|---|---|---|---|---|---|---|---|---|---|---|---|---|---|---|---|---|---|---|---|---|---|---|---|---|---|
| Pedro Santos (4.256 -0.006) | SG | 36 |
PG
|
PG
|
PG
|
PG
|
PG
|
PG
|
PG
|
PG
|
PG
|
PG
|
SF
|
SF
|
PG
|
PG
|
SG
|
PG
|
PG
|
PG
|
|||||||||
| Garrick Jurkin (4.224 -0.010) | SF | 34 |
SG
|
SG
|
PF
|
SG
|
SG
|
PG
|
SG
|
SG
|
SG
|
SG
|
SG
|
SF
|
SG
|
SG
|
SG
|
SG
|
SG
|
||||||||||
| Kaimyn Fry (3.025 -0.017) | PF | 28 |
C
|
C
|
C
|
C
|
C
|
C
|
C
|
C
|
C
|
C
|
C
|
PF
|
PF
|
PF
|
|||||||||||||
| Tyrae Lewis (2.858 -0.013) | SG | 24 |
SF
|
SF
|
SF
|
SF
|
SF
|
SF
|
PG
|
PG
|
PG
|
SG
|
PG
|
PG
|
|||||||||||||||
| Shaun Ackerman (3.096 -0.015) | SG | 22 |
PF
|
PF
|
PF
|
PG
|
SG
|
SG
|
SG
|
PF
|
PF
|
PG
|
PF
|
||||||||||||||||
| LaMarcus Quinn (3.207 -0.015) | SG | 20 |
SF
|
SF
|
SF
|
SF
|
SF
|
SF
|
SF
|
SF
|
SF
|
SF
|
|||||||||||||||||
| Hudson Leonard (3.703 -0.014) | SG | 18 |
PF
|
PF
|
PF
|
PF
|
PF
|
PF
|
PF
|
PF
|
PF
|
||||||||||||||||||
| Kel Pendergast (3.964 -0.015) | SG | 16 |
SG
|
SG
|
SG
|
SG
|
SG
|
SF
|
SF
|
SF
|
|||||||||||||||||||
| Robert Alcegaire (3.039 -0.015) | PF | 14 |
C
|
C
|
C
|
SF
|
C
|
C
|
C
|
||||||||||||||||||||
| Devaugntah Litton (2.873 -0.016) | PF | 12 |
PF
|
C
|
PF
|
PF
|
PF
|
PF
|
|||||||||||||||||||||
| John Ford (3.465 -0.013) | PF | 12 |
C
|
C
|
C
|
C
|
C
|
C
|
|||||||||||||||||||||
| Tyrique Beaudean (3.274 -0.014) | SG | 4 |
SF
|
PG
|
Minutes Distribution
240/240| Player | Pos | WV | Adj | Target | Blocks | Season MPG | Promise | END |
|---|---|---|---|---|---|---|---|---|
| Pedro Santos | SG | 4.256 | -0.006 | 40 | 36 | 29.7 | Starter | 15 |
| Garrick Jurkin | SF | 4.224 | -0.010 | 36 | 34 | 31.5 | Starter | 19 |
| Kaimyn Fry | PF | 3.025 | -0.017 | 30 | 28 | 31.2 | Starter | 7 |
| Tyrae Lewis | SG | 2.858 | -0.013 | 28 | 24 | 30.7 | Starter | 8 |
| Shaun Ackerman | SG | 3.096 | -0.015 | 22 | 22 | 0 | Deep | 17 |
| LaMarcus Quinn | SG | 3.207 | -0.015 | 28 | 20 | 30.7 | Starter | 13 |
| Hudson Leonard | SG | 3.703 | -0.014 | 14 | 18 | 13.6 | Bench | 16 |
| Kel Pendergast | SG | 3.964 | -0.015 | 14 | 16 | 16.7 | Bench | 15 |
| Robert Alcegaire | PF | 3.039 | -0.015 | 12 | 14 | 11.3 | Bench | 11 |
| Devaugntah Litton | PF | 2.873 | -0.016 | 6 | 12 | 6.5 | Deep | 10 |
| John Ford | PF | 3.465 | -0.013 | 6 | 12 | 5.5 | Deep | 18 |
| Tyrique Beaudean | SG | 3.274 | -0.014 | 4 | 4 | 3.7 | Deep | 11 |