
New York Renegades
50-33 (60.2%)
PLAYOFF CONTENDER
Win Rank
19/36
PPG Scored
114.4
PPG Allowed
109.5
Pt Diff
+4.9
Trend
IMPROVING
Scouting Radar
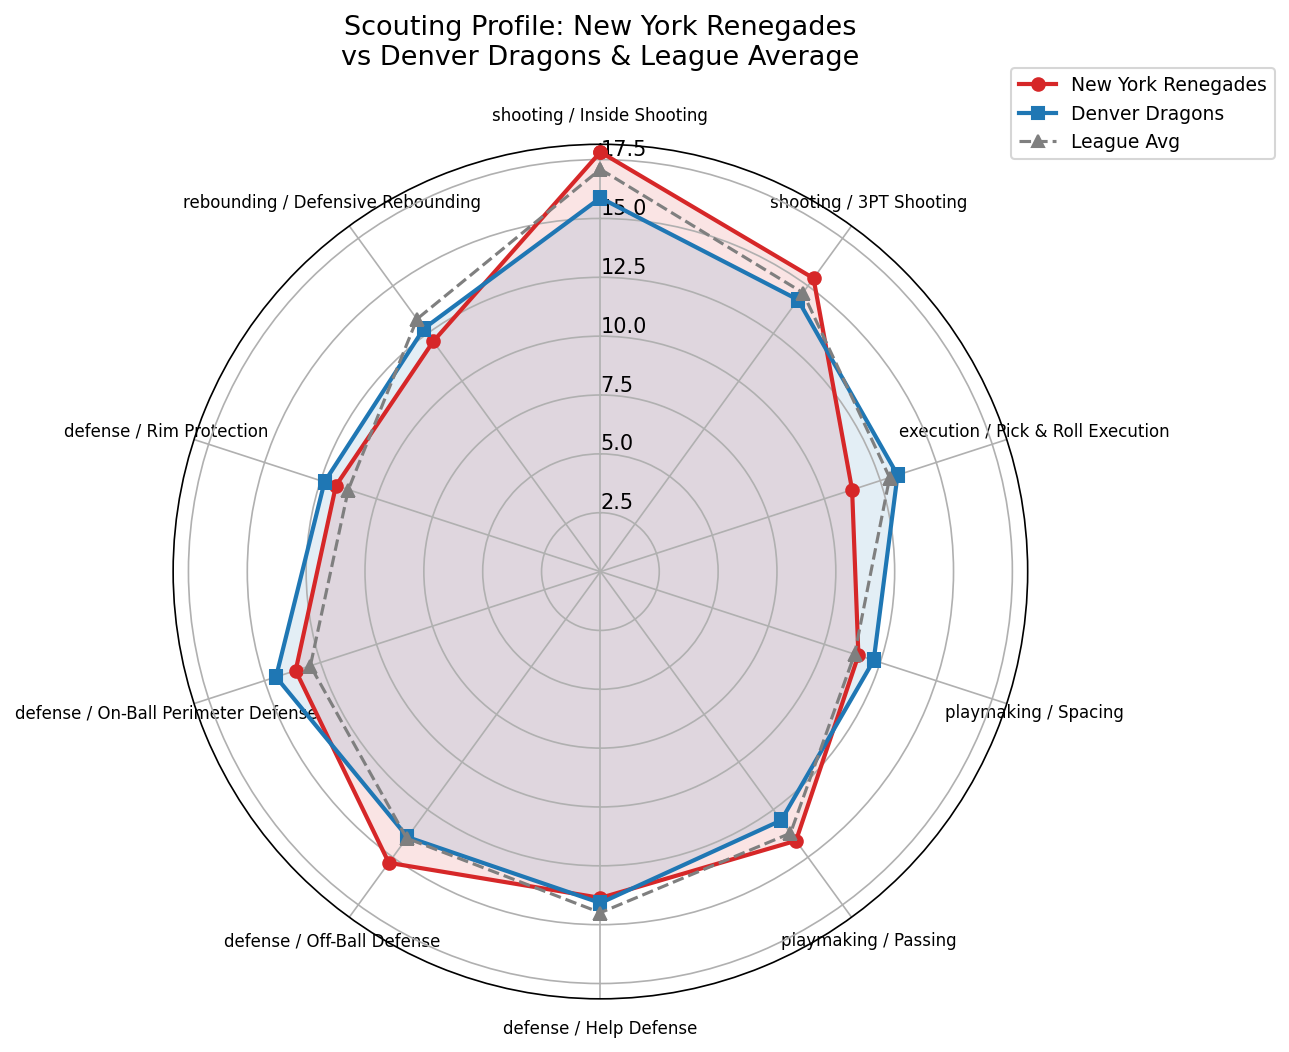
Offensive Profile
Morey Ball strong 3PT shooting team; strong inside scoring; drive-heavy
System Proficiency
Morey Ball 20.0
Balanced 15.6
Pace & Space 15.0
Perimeter Centric 8.7
Inside Shooting
17.8
+0.7
3PT Shooting
15.4
+0.8
Pick & Roll Execution
11.2
-1.7
Spacing
11.5
+0.2
Passing
14.1
+0.4
Ball Handling
13.2
+0.7
Self-Creation
15.7
+1.1
Finishing
17.3
+2.2
Shoot Off Dribble
10.8
+0.6
Gravity
12.3
-1.4
Primary Scoring Options
Stephan Rayner
28.4 PPG | 37.0% USG | 58.6% TS | 34.4% 3P
Josiah Peters
15.9 PPG | 33.9% USG | 60.1% TS | 31.1% 3P
Khadim Flowers
15.3 PPG | 20.2% USG | 58.2% TS | 35.8% 3P
Key Tendencies
Driving frequency:
57%
Defensive Profile
109.5 (rank 15/36)
Help Defense
13.9
-0.6
Off-Ball Defense
15.3
+1.3
On-Ball Perimeter Defense
13.6
+0.7
Rim Protection
11.8
+0.6
Defensive Rebounding
12.1
-1.2
Post Defense
10.4
-1.0
Stealing
14.0
+0.9
Defensive Archetypes
Wing Stopper x4
Anchor Big x2
Strengths & Weaknesses
Advantages
Finishing
+2.17
Quickness
+1.52
Speed
+1.49
Off-Ball Defense
+1.29
Self-Creation
+1.05
Pick & Roll Execution
-1.68
Gravity
-1.36
Endurance
-1.27
Offensive Rebounding
-1.20
Defensive Rebounding
-1.18
Weaknesses
Pick & Roll Execution
-1.68
Gravity
-1.36
Endurance
-1.27
Offensive Rebounding
-1.20
Defensive Rebounding
-1.18
Exploitable Matchups (Denver Advantage)
Pick & Roll Execution
Opp 11.2 vs Den 13.3
+2.03
Endurance
Opp 9.8 vs Den 12.8
+2.94
Isolation Execution
Opp 12.7 vs Den 14.1
+1.39
Post Defense
Opp 10.4 vs Den 11.4
+1.06
Strength
Opp 11.8 vs Den 14.6
+2.79
Denver Game Plan
1. DRIVE AND KICK: Poor help defense (13.9 vs 14.5 lg avg). Penetrate and collapse the defense for open kickouts.
2. CRASH THE BOARDS: Poor defensive rebounding (12.1 vs 13.3 lg avg). Send offensive rebounders for second-chance points.
3. DEFEND THE ARC: Strong 3PT team (15.4 vs 14.6 lg avg). Close out hard on shooters, contest every three.
4. KEY ASSIGNMENT: Contain Stephan Rayner (28.4 PPG, 37.0% USG). Assign best perimeter defender, deny touches.
Denver Edges
Shoot Off Dribble
+1.46
Post Defense
+1.06
Basketball IQ
+1.60
Isolation Execution
+1.39
Pick & Roll Execution
+2.03
Denver Disadvantages
Foul Drawing
-3.86
Post Execution
-2.82
Playmaking
-2.78
Finishing
-2.78
Self-Creation
-2.56
Recommended Defensive Settings
Intensity
Conservative
Focus
Perimeter
Low
Guard Screen Def
Under
Big Screen Def
Drop
Press
Never
Zone
Never
Emphasis (Pick 2)
1.
Challenge Every Shot
3PA 30.8/g (league avg 29.3)
2.
Protect The Rim
2PT scoring share 54% (league avg 50%)
Perimeter-heavy (3PT share 46%, 2PT share 54%)
Season Results
Home
50-32
Away
0-0
Last 10
7-3 (avg pt diff: +6.4)
Streak
W4
Best Win Streak
9
Worst Loss Streak
5
Matchup Adjustments
- ◆ Exploit Endurance: Denver 13 vs Opp 10 (+3 edge)
- ◆ Target Pick & Roll Execution: Opp 11 (lg avg 13)
Depth Chart vs New York Renegades
PG
Kel Pendergast
3.960
Hudson Leonard
3.697
Pedro Santos
Garrick Jurkin
SG
Garrick Jurkin
4.214
LaMarcus Quinn
3.202
Tyrae Lewis
Pedro Santos
SF
LaMarcus Quinn
3.202
Garrick Jurkin
4.214
Shaun Ackerman
Tyrae Lewis
PF
Devaugntah Litton
2.868
John Ford
3.458
Kaimyn Fry
Hudson Leonard
C
Kaimyn Fry
3.022
Devaugntah Litton
2.868
Robert Alcegaire
John Ford
24-Block Assignment
Each column = 2-minute game segment. Separators at Q1|Q2, Halftime, Q3|Q4. Letters show assigned position.
| Player | Pos | Min | 2 | 4 | 6 | 8 | 10 | 12 | Q2 | 14 | 16 | 18 | 20 | 22 | 24 | HT | 26 | 28 | 30 | 32 | 34 | 36 | Q4 | 38 | 40 | 42 | 44 | 46 | 48 |
|---|---|---|---|---|---|---|---|---|---|---|---|---|---|---|---|---|---|---|---|---|---|---|---|---|---|---|---|---|---|
| Garrick Jurkin (4.214 -0.020) | SF | 34 |
SF
|
SF
|
SG
|
PF
|
PG
|
PF
|
SG
|
SG
|
SG
|
SG
|
SG
|
PF
|
SG
|
PF
|
SG
|
SG
|
SG
|
||||||||||
| Kaimyn Fry (3.022 -0.020) | PF | 32 |
C
|
C
|
C
|
C
|
C
|
C
|
C
|
C
|
C
|
C
|
C
|
C
|
C
|
PF
|
PF
|
PF
|
|||||||||||
| Pedro Santos (4.242 -0.020) | SG | 28 |
SG
|
PG
|
SG
|
PG
|
PG
|
PG
|
SG
|
PG
|
SG
|
PG
|
PG
|
PG
|
PG
|
PG
|
|||||||||||||
| Tyrae Lewis (2.851 -0.020) | SG | 26 |
SF
|
SF
|
SF
|
SF
|
SF
|
SF
|
PG
|
PG
|
PG
|
SG
|
PG
|
SF
|
PG
|
||||||||||||||
| LaMarcus Quinn (3.202 -0.020) | SG | 24 |
SF
|
SF
|
SG
|
SF
|
PG
|
SF
|
SF
|
SF
|
SF
|
SF
|
SF
|
SF
|
|||||||||||||||
| Shaun Ackerman (3.092 -0.020) | SG | 24 |
PF
|
PF
|
PF
|
PF
|
SG
|
PF
|
PF
|
SG
|
PF
|
PG
|
SG
|
SG
|
|||||||||||||||
| Hudson Leonard (3.697 -0.020) | SG | 18 |
PG
|
PF
|
PF
|
PF
|
PF
|
PF
|
PG
|
SG
|
PF
|
||||||||||||||||||
| Kel Pendergast (3.960 -0.020) | SG | 14 |
PG
|
SF
|
SF
|
PG
|
SF
|
SF
|
SF
|
||||||||||||||||||||
| Robert Alcegaire (3.034 -0.020) | PF | 14 |
C
|
C
|
PF
|
C
|
C
|
C
|
C
|
||||||||||||||||||||
| Tyrique Beaudean (3.269 -0.020) | SG | 10 |
PG
|
SG
|
PG
|
SG
|
SG
|
||||||||||||||||||||||
| Devaugntah Litton (2.868 -0.020) | PF | 8 |
PF
|
PF
|
C
|
C
|
|||||||||||||||||||||||
| John Ford (3.458 -0.020) | PF | 8 |
C
|
C
|
C
|
PF
|
Minutes Distribution
240/240| Player | Pos | WV | Adj | Target | Blocks | Season MPG | Promise | END |
|---|---|---|---|---|---|---|---|---|
| Garrick Jurkin | SF | 4.214 | -0.020 | 34 | 34 | 31.5 | Starter | 19 |
| Kaimyn Fry | PF | 3.022 | -0.020 | 28 | 32 | 31.2 | Starter | 7 |
| Pedro Santos | SG | 4.242 | -0.020 | 50 | 28 | 29.7 | Starter | 15 |
| Tyrae Lewis | SG | 2.851 | -0.020 | 28 | 26 | 30.7 | Starter | 8 |
| LaMarcus Quinn | SG | 3.202 | -0.020 | 26 | 24 | 30.7 | Starter | 13 |
| Shaun Ackerman | SG | 3.092 | -0.020 | 22 | 24 | 0 | Deep | 17 |
| Hudson Leonard | SG | 3.697 | -0.020 | 12 | 18 | 13.6 | Bench | 16 |
| Kel Pendergast | SG | 3.960 | -0.020 | 14 | 14 | 16.7 | Bench | 15 |
| Robert Alcegaire | PF | 3.034 | -0.020 | 10 | 14 | 11.3 | Bench | 11 |
| Tyrique Beaudean | SG | 3.269 | -0.020 | 4 | 10 | 3.7 | Deep | 11 |
| Devaugntah Litton | PF | 2.868 | -0.020 | 6 | 8 | 6.5 | Deep | 10 |
| John Ford | PF | 3.458 | -0.020 | 6 | 8 | 5.5 | Deep | 18 |